What I Care About This Week | 2021 Oct 4

by Franklin J. Parker, CFA

The Summary

  • The Fed has indicated that it will likely begin slowing their money-printing program as soon as November, and they expect to be completely done printing money by “around the middle of next year.” That would mean the Fed would likely print about $13 billion less per month until July (so, $107 billion in November, then $94 billion in December, etc). This announcement gives investors something to plan on, which is helpful, but it was the more aggressive pace of rate hikes that spooked investors. With inflation stubbornly high and employment still recovering, the Fed is caught between its two mandates. It is a tightrope to walk, and the consequences of getting it wrong are severe.

  • Speaking of the Fed, Boston Fed President Eric Rosengren and Dallas Fed President Robert Kaplan both resigned after their annual financial disclosures showed that they had each traded stocks and mutual funds quite profitably through 2020. It was clear from the pattern of trading that they were informed by their position within the Fed, as several trades occurred just days before major policy announcements that moved markets. While this would normally be just another instance of political insiders using their position for personal gain, given the outsized role of the Fed, and the influence of both Rosengren and Kaplan within the institution, this event is notable for investors. The exit of these two is likely to shift the dynamic of the Fed’s policy discussions.

  • As I mentioned last week, I see current volatility as relatively short-lived (likely 3-4 weeks), though we may see a pullback of 8%-10% from the recent high in the S&P 500. This marks a great entry point for investors with cash, and is not a big enough deal to justify selling out of highly-appreciated stock positions. In short, my view is that investors who are in should stay in and investors who are out should use this pullback to get in. There is, of course, a risk that this selloff develops into something more significant. I will be watching closely for signals that that is the case, and position portfolios accordingly.

The Details

Inflation is again on everyone’s mind.

Whether high inflation readings are the result of monetary policy—and thus under the control of the Fed—or whether they are driven by supply constraints is central to the debate. How investors answer that question will determine portfolio allocations, so this is a central questions that must be wrestled with.

The Fed has maintained that high inflation figures are from supply constraints caused by COVID and other supply-chain disruptions. Others have insisted that easy monetary policy (i.e. low interest rates and money printing) are to blame.

I have a more nuanced view.

In a normal recession recovery, employment is the last to recover. That leaves many people with less cash than they had in the expansion, and so the demand for goods and services is rather slack. Once the economy reaches full employment, demand again increases and price inflation begins to manifest.

Employment has behaved similarly in this recovery as in past ones (though it has recovered faster than in previous recessions). However, unlike in past recoveries, extended unemployment benefits and numerous rounds of stimulus has given people substantially more buying power than they would otherwise have. This excess buying power has yielded much higher demand for goods and services than we would normally have. Given that there are more job openings than unemployed persons, this indicates that production and demand are significantly mismatched in our economy.

Of course, while not specifically driven by monetary policy, these extra benefits have been paid with newly-printed money from the Federal Reserve.

Current inflation, then, is caused by both monetary policy and ongoing supply constraints.

For investors, this means that the amount of inflation we can expect to fade is the part driven by supply constraints. This is okay news—not great and not bad. Inflation should abate somewhat, and the Fed’s tightening schedule may serve to reign in some of the monetary portion of the problem. Of course, the Fed’s tightening schedule will also serve to slow economic growth, as well. There is a tug of war at play.

As I have said many times before, the most important attribute for investors right now is flexibility. We must take this one data point at a time and be willing to make portfolio adjustments based on new data, especially inflation.

Chart of the Week

This week’s chart comes from the Wall Street Journal, and demonstrates the percentage of items that have seen price increases. As the chart shows, we are seeing the highest number of items with price increases since 2009. Much higher and this would put us back into the 1980s, a period characterized by higher-than-desired inflation. In the end, this is worth keeping a close eye on.

This document is a general communication being provided for informational purposes only. It is educational in nature and not designed to be taken as advice or a recommendation for any specific investment product, strategy, plan feature or other purpose in any jurisdiction, nor is it a commitment from Directional Advisors to participate in any of the transactions mentioned herein. Any examples used are generic, hypothetical and for illustration purposes only. This material does not contain sufficient information to support an investment decision and it should not be relied upon by you in evaluating the merits of investing in any securities or products. In addition, users should make an independent assessment of the legal, regulatory, tax, credit, and accounting implications and determine, together with their own financial professionals, if any investment mentioned herein is believed to be appropriate to their personal goals. Investors should ensure that they obtain all available relevant information before making any investment. Any forecasts, figures, opinions or investment techniques and strategies set out are for information purposes only, based on certain assumptions and current market conditions and are subject to change without prior notice. All information presented herein is considered to be accurate at the time of production, but no warranty of accuracy is given and no liability in respect of any error or omission is accepted. It should be noted that investment involves risks, the value of investments and the income from them may fluctuate in accordance with market conditions and taxation agreements and investors may not get back the full amount invested. Both past performance and yields are not reliable indicators of current and future results.

Market Update – 2021 Sept 28

by Franklin J. Parker, CFA

Rather than the regularly-scheduled weekly update, I feel that recent market gyrations justify a special and more focused update. Let’s first look at what prices are doing and how this fits in my short-term view. Then, let’s address how this affects our investment strategy.

Short-Term Market View

The past week and a half have seen stocks generally selling-off, with tech stocks leading the way. “Selling-off” is relative, of course. Despite all the drama, the S&P 500 was down less than 6% from its recent high, which is not particularly noteworthy. We get about a 4% selloff every month, and an 8% to 10% selloff about every year.

What is noteworthy is the change of character in stocks. The upward trend that has been in place since the beginning of 2021 was firmly broken last week (see chart below). That signals to me that, in the short-term at least, the S&P 500 (and stocks more broadly) may trade sideways for the next few weeks: bouncing between about 4460 at the high and around 4180 as a low (if I had to guess—emphasis on guess).

This is, by the way, quite similar to the pattern we saw in 2020. As the chart below demonstrates, we had a firm upward channel that had formed in the S&P 500’s price that was broken around September. That break began a sideways trading range that lasted about a month. Around November, however, markets began to again march higher and that formed the upward channel that we have been in since January of this year—the channel that was just broken.

Portfolio Strategy

While prices may move a bit lower in the short-term, this is not worth paying taxable gains to avoid by selling out of positions. At most, I could see markets selling down about 10% from their recent high, but that would still put our portfolios up for the year. Furthermore, as I mentioned above, I see this as short-lived, maybe a month to a month and a half at most.

Longer-term, I see both the Fed’s ongoing money-printing and the economy’s ongoing re-opening/expansion to put a tailwind to stock prices. Any pullback, then, is likely to be short-lived, in my view.

Investors, then, should use any pullback to deploy excess cash and/or rebalance their portfolios.

These short-term swings, as anyone will tell you, are notoriously hard to gauge. For investors who have longer time horizons, we really should not be too concerned about them—especially since the costs of attempting to avoid them can be excessive. Selling appreciated investments creates a tax cost. Getting back in at exactly the right time is very difficult as markets tend to reverse course quite quickly and often for no reason at all. That means we can be left in cash as stocks rally.

All-in-all, exactly how you position your investment portfolio will be a function of many things, most importantly your particular goals. For a market that has given few opportunities to enter at more reasonable levels, my bias is to see this as an entry point, not an exit.

I would, of course, be delighted to talk this through with you.

This document is a general communication being provided for informational purposes only. It is educational in nature and not designed to be taken as advice or a recommendation for any specific investment product, strategy, plan feature or other purpose in any jurisdiction, nor is it a commitment from Directional Advisors to participate in any of the transactions mentioned herein. Any examples used are generic, hypothetical and for illustration purposes only. This material does not contain sufficient information to support an investment decision and it should not be relied upon by you in evaluating the merits of investing in any securities or products. In addition, users should make an independent assessment of the legal, regulatory, tax, credit, and accounting implications and determine, together with their own financial professionals, if any investment mentioned herein is believed to be appropriate to their personal goals. Investors should ensure that they obtain all available relevant information before making any investment. Any forecasts, figures, opinions or investment techniques and strategies set out are for information purposes only, based on certain assumptions and current market conditions and are subject to change without prior notice. All information presented herein is considered to be accurate at the time of production, but no warranty of accuracy is given and no liability in respect of any error or omission is accepted. It should be noted that investment involves risks, the value of investments and the income from them may fluctuate in accordance with market conditions and taxation agreements and investors may not get back the full amount invested. Both past performance and yields are not reliable indicators of current and future results.

What I Care About This Week | 2021 September 20

by Franklin J. Parker, CFA

Summary

  • It is Fed week! Most investors expect the Fed to announce a schedule for their tapering operation. However, the big news will be the updated pace of expected rate hikes. For the most part, investors have priced in a taper to begin in November and end next August/September. The unknown is how quickly interest rates will rise after quantitative easing is finished. That will be the new source of volatility.

  • Treasury secretary Janet Yellen is repeating warnings about the debt ceiling to congress. She has reminded them that, without a debt ceiling raise, a default on US Treasury debt is likely. Unfortunately, she has been unable to give congress an exact date and has instead said “sometime in October.” We have, of course, been through this before. The debt ceiling has become a game of political brinksmanship and has led to several government shutdowns and furloughed workers in the past. Investors have learned to shrug this off. The consequences of a US Treasury default, however, would be catastrophic. Lawmakers are well aware of this, of course, so I advise investors to watch it, but not yet worry much about it.

  • Economic data lately has been mixed. In addition to the Fed meeting (which will dominate investor’s newsfeeds), we get data on housing, initial unemployment claims, Markit’s PMI figures, and durable goods sales. All of these are important to watch, especially as investors are struggling to find direction.

The Details

With the Fed on track to end its support of markets, and most of the ongoing Covid financial support from central governments ending, investors have been left struggling for direction. Over the past 18 months, the dominant focus has moved from economic fundamentals to the role of global central banks in offsetting the pain of the Covid-induced recession. Now, investors have begun to return their attention to these fundamentals, which are, admittedly, mixed.

To be fair, it does not appear that a recession is on the horizon. The central question is whether markets have run too far too fast on the hope of a rebound from Covid that is, perhaps, more disappointing than was otherwise expected. And the data is somewhat mixed. On the one hand, consumers continue to spend, job openings are plentiful, and corporate profits growth is quite strong. On the other hand, the unemployment rate is high, inflation is holding at stubbornly high levels, and supply constraints and transportation costs continue to plague earnings outlooks. It can be easy to see why major investment shops are increasingly calling for a market correction (or at least subpar returns).

In my view, numerous structural issues exist that are contributing to poor data, and many of those issues should be worked through over the coming six to nine months. The Fed’s retreat will feed volatility, no doubt, but I see a market downswing as a buying opportunity for investors with cash. For longer-term investors, a downswing is likely to be short-lived and relatively shallow, not worth worrying much about.

Of course, I am actively concerned with being wrong, so this view may well change as markets and data develop.

Chart of the Week

From a technical analysis perspective, the S&P 500 has clearly exited the trading channel that has dominated price action since the start of 2021 (top chart). This is likely to indicate some sideways consolidation for a time, which is very similar to what we saw in the last half of 2020 (bottom chart). The point is that this change of character, while worth acting on for short-term trading, investing cash, or even rebalancing a portfolio, is a pretty normal yearly occurrence. Stocks tend to lose 3% to 5% every month and quickly recover. They also tend to lose 8% to 10% about once a year and quickly recover.

Of course, your goals will always dictate how we behave in any market environment, including this one.

This document is a general communication being provided for informational purposes only. It is educational in nature and not designed to be taken as advice or a recommendation for any specific investment product, strategy, plan feature or other purpose in any jurisdiction, nor is it a commitment from Directional Advisors to participate in any of the transactions mentioned herein. Any examples used are generic, hypothetical and for illustration purposes only. This material does not contain sufficient information to support an investment decision and it should not be relied upon by you in evaluating the merits of investing in any securities or products. In addition, users should make an independent assessment of the legal, regulatory, tax, credit, and accounting implications and determine, together with their own financial professionals, if any investment mentioned herein is believed to be appropriate to their personal goals. Investors should ensure that they obtain all available relevant information before making any investment. Any forecasts, figures, opinions or investment techniques and strategies set out are for information purposes only, based on certain assumptions and current market conditions and are subject to change without prior notice. All information presented herein is considered to be accurate at the time of production, but no warranty of accuracy is given and no liability in respect of any error or omission is accepted. It should be noted that investment involves risks, the value of investments and the income from them may fluctuate in accordance with market conditions and taxation agreements and investors may not get back the full amount invested. Both past performance and yields are not reliable indicators of current and future results.

What I Care About This Week | 2021 September 13

by Franklin J. Parker, CFA

The Summary

  • This week will be all about inflation. We get headline inflation figures tomorrow which will be closely watched. Investors will want to gauge whether the Fed has a hope of continuing easy monetary policy, or if a quicker end is more likely. Inflation is expected to post around 5.3% year-over-year. This week we also get industrial production figures and retail sales, both important reads on the health and persistence of the recovery. Jobless claims on Thursday will also be closely watched to indicate whether the Delta variant is beginning to affect the labor market.

  • Democrats are talking about a tax plan that increases corporate rates to 26.5% and capital gains 25%. While the full details have not been released, investors should largely see this as a non-event. The highest tax bracket has very little bearing on the effective tax rate that companies pay. A slight increase in that bracket is not likely to increase the actual taxes paid by businesses. Increasing the capital gains rate to 25% would have some transient effects on markets (both public and private). More than anything, I would expect this to encourage capital flight from high tax states, but with such a small increase the effect may be minor. In short, investors should watch the process to ensure it remains a minimal concern, but it is not worth worrying about.

The Details

Everyone is talking about how stocks are going to go down.

Bank of America, Morgan Stanley, Deutche Bank, just to name a few, all released research reports in the past couple of weeks detailing their view that stocks have run their course and a correction is coming—or will at best trade sideways for awhile. I find myself scratching my head at this. Not much has really changed over the past couple of weeks. Sure, the Fed is talking about ending their supportive policy, but earnings are still very strong, and the Fed is still printing significant money through the beginning of next year at least. I could well be wrong, of course, and I have advocated being very flexible in this environment. If prices do begin to weaken substantially, we will take appropriate action in our portfolios.

Here is how I see markets evolving over the coming few years. Longer-term forecasting is fraught, of course, but here is my rough framework.

For the next six months, the Fed is still in play and earnings growth is quite strong. Both are tailwinds to equity prices. Yes, investors have begun to price away the Fed, but they have done so by shrinking valuations and earnings growth has, so far, offset that effect, leaving prices mostly flat. This is healthy, in my view.

Next summer, however, the Fed will have ended their support and investors will begin to price-in the rate hikes that are expected in early 2023. In addition, I would expect earnings growth to have moderated by next summer, so that leaves markets in a much more fragile state. A 10% to 15% correction is in the cards around late spring or early summer of 2022.

If history is any guide, the Fed will get a year or two of rate hikes before a recession sets in (see the chart of the week below). That puts a recession in late 2024 or 2025—giving the current business cycle a four/five-year expansion, which is about average.

Again, flexibility is key in this environment, but as the data stands, this is more-or-less how I see the business cycle evolving. So, despite the current hand-wringing from Wall Street analysts, I think investors have some upside yet to harvest. And, for those keen to be more active, there is some genuine opportunity in the coming year.

Chart of the Week

Historically, Fed rate hikes precede recessions by about 24 months. It is not the rate hike itself, however, that is indicative of recessions, but rather the Fed’s reversal. Once the rate hike cycle is complete and the Fed begins to again lower rates, that is when a recession is not far behind. The Fed started lowering rates in June of 1989, one year before the recession of July 1991. In January 2001, the Fed lowered rates one month before the recession that began in February of 2001, a similar circumstance to the recession that began in 2007. Finally, the Fed lowered rates in August of 2019, seven months before the recession that began in March of 2020.

In short, the Fed tends to act like a recession is brewing before one actually starts, but that is typically the last signal we get before the recession hits—markets will price it long before the Fed does. The Fed’s actions, then, tend to be a confirmatory signal rather than a leading indicator.

This document is a general communication being provided for informational purposes only. It is educational in nature and not designed to be taken as advice or a recommendation for any specific investment product, strategy, plan feature or other purpose in any jurisdiction, nor is it a commitment from Directional Advisors to participate in any of the transactions mentioned herein. Any examples used are generic, hypothetical and for illustration purposes only. This material does not contain sufficient information to support an investment decision and it should not be relied upon by you in evaluating the merits of investing in any securities or products. In addition, users should make an independent assessment of the legal, regulatory, tax, credit, and accounting implications and determine, together with their own financial professionals, if any investment mentioned herein is believed to be appropriate to their personal goals. Investors should ensure that they obtain all available relevant information before making any investment. Any forecasts, figures, opinions or investment techniques and strategies set out are for information purposes only, based on certain assumptions and current market conditions and are subject to change without prior notice. All information presented herein is considered to be accurate at the time of production, but no warranty of accuracy is given and no liability in respect of any error or omission is accepted. It should be noted that investment involves risks, the value of investments and the income from them may fluctuate in accordance with market conditions and taxation agreements and investors may not get back the full amount invested. Both past performance and yields are not reliable indicators of current and future results.

What I Care About This Week | 2021 Aug 30

by Franklin J. Parker, CFA

The Summary

  • The Fed’s annual Jackson Hole symposium (virtual this year) dominated market sentiment last week. In the end, chairman Powell declined to offer a specific timetable for tapering asset purchases, however he did suggest that it is likely to begin before the end of this year. That would likely put an announcement for timing at the September meeting, with a beginning to tapering in November or December. What caught market attention were his comments with regard to interest rates. Powell suggested that the Fed would be in no hurry to raise interest rates after tapering. Markets bounced at that comment.

  • This week we get the usual beginning-of-the-month flurry of data. Consumer confidence figures post today, PMI data posts on Wednesday, weekly initial jobless claims post on Thursday along with factory orders, and Friday we get the headline unemployment rate and personal income stats. The headline unemployment rate continues to be a closely-watched figure as it is a key input into the Fed’s assessment of economic health. Headline unemployment is expected in around 5.2% and personal incomes are expected to have grown about 4% year-over-year.

  • Obviously, your financial goals will be the ultimate arbiter of your portfolio strategy. From a macro perspective, however, my advice has generally been to be invested, despite the absurd valuations at which companies are currently trading. Those stretched valuations are entirely the result of current central bank policy, and are likely to normalize as the Fed removes their support (which may or may not mean lower prices). However, the Fed is continuing to support markets at least through the end of the year, and corporate earnings have been very good overall. This gives investors two tailwinds until at least December. Furthermore, August price action has been a good sign. Corporate earnings growth has been very strong and rather than continue to run higher, prices were largely flat. This means that valuations have already begun to moderate, and to moderate without a loss to price. Of course, there are plenty of risks to investors in markets, but overall, at least for the moment, I see an upward bias in prices.

The Details

Of all the factors that drive investment returns—whether it be momentum, relative valuation, size, country, or sector—the most important factor in 2021 has been share price. On its own, share price is a meaningless statistic. Companies can change the number of shares they have to change the price (doubling the number of shares cuts the share price in half, for example), and that does nothing to change the actual value of the business. Even still, this meaningless statistic has been the most reliable predictor of returns in 2021.

Why?

To understand my perspective, we need to first understand how people interact with financial markets.

Traditional theory would suggest that prices are always right—they will always reflect all fundamentals of a business and expectations for the future. While I do generally agree that people will quickly adjust prices to new information, I find that whole theory woefully incomplete. My own research indicates (and I’m not the only one, of course) that people interact with financial markets with the intent to accomplish goals. They want to retire, send children to college, and buy a vacation home. These goals come in all shapes and sizes, and tend to range in importance. Some are absolutely required, some are nice-to-haves, and some are aspirational. Because of these objectives, investors will consider not just all information about an investment, but also how well that fulfills the job they need doing. In the aggregate, then, prices reflect all information about the security, and also the needs of all investors.

This is, in my view, the only way to explain many of the “anomalies” we see in markets today, like how low share prices can be a return driver.

Now, for goals with low importance—goals we may dub as aspirational—my research also predicts that investors will pay a higher price for more volatility, for more risk. People gamble, in other words, and, in some instances, it may be rational to do so. This is, of course, completely counter to traditional economic theory, but it is supported by peer-reviewed logic and rigorous math.

The price action we have seen in meme stocks (like AMC, BB, and GME), along with the excess return we have seen in low-priced stocks, is consistent with investors who (1) see lower-priced stocks as a source of excess volatility, and (2) have seen significant cash inflows. Given those two conditions, these anomalies are entirely predictable with a goals-based theory of markets.

Chart of the Week

Covid relief programs have, up until recently, made up a significant portion of year-over-year growth in personal incomes. As more workers return to the work force, Covid relief programs come to an end, and inflation in higher from supply constraints, the growth in personal incomes have started to lag inflation. This may be transient. However, it is also indicative of a liquidity trap, and may be an ongoing consequence of excessive money-printing. Investors should keep a close eye on these figures in coming years. If this is a long-term effect, it will significantly dent consumer spending.

This document is a general communication being provided for informational purposes only. It is educational in nature and not designed to be taken as advice or a recommendation for any specific investment product, strategy, plan feature or other purpose in any jurisdiction, nor is it a commitment from Directional Advisors to participate in any of the transactions mentioned herein. Any examples used are generic, hypothetical and for illustration purposes only. This material does not contain sufficient information to support an investment decision and it should not be relied upon by you in evaluating the merits of investing in any securities or products. In addition, users should make an independent assessment of the legal, regulatory, tax, credit, and accounting implications and determine, together with their own financial professionals, if any investment mentioned herein is believed to be appropriate to their personal goals. Investors should ensure that they obtain all available relevant information before making any investment. Any forecasts, figures, opinions or investment techniques and strategies set out are for information purposes only, based on certain assumptions and current market conditions and are subject to change without prior notice. All information presented herein is considered to be accurate at the time of production, but no warranty of accuracy is given and no liability in respect of any error or omission is accepted. It should be noted that investment involves risks, the value of investments and the income from them may fluctuate in accordance with market conditions and taxation agreements and investors may not get back the full amount invested. Both past performance and yields are not reliable indicators of current and future results.

What I Care About This Week | 2021 Aug 23

by Franklin J. Parker, CFA

The Summary

  • The big data point his week is the Federal Reserve’s annual symposium in Jackson Hole, Wyoming. Investors are somewhat divided in expectations for the meeting. Some expect the Fed to make clear the timetable for tapering asset purchases. Other seems to expect nothing new to come from this meeting, that the Fed will make an announcement in their September meeting. Option markets seem to indicate that this will be a non-event.

  • The Fed’s meeting minutes posted last week. It showed that several FOMC members are eager to begin tapering, and markets repriced the timing. The consensus is now that the Fed will begin tapering in November of this year. Again, as I have repeatedly talked about before, the Fed ending support of markets does not necessarily mean prices will go down. If corporate earnings growth makes up the difference, prices may hold or continue their uptrend, and with earnings season almost complete, this is exactly what we have seen. Corporate earnings have grown by about 85%—much more than expected—but prices have remained mostly flat. This has naturally lowered valuations without hurting price.

  • Our current portfolio strategy is flexibility. For now, both earnings growth and the ongoing actions of the Fed are creating a tailwind for markets. Beginning early next year, however, the Fed’s change in policy will turn that tailwind into a tug-of-war between the positive effects of earnings growth and the negative effects of the Fed’s normalization. Positioning will be informed by the ongoing data and market dynamics at the time.

Recession Dashboard

This week, let’s check in on my recession dashboard.

First we have the GDP output gap, which is the difference between the theoretical output of the economy and its actual output. When the economy is producing less than it is able, this figure is positive. When it is producing more than it is theoretically able to, then the figure is negative. Historically, when the gap closes (goes negative), a recession is not too far behind. This is typically the earliest warning we get of a coming recession. As you can see, the figure is firmly in the growth zone.

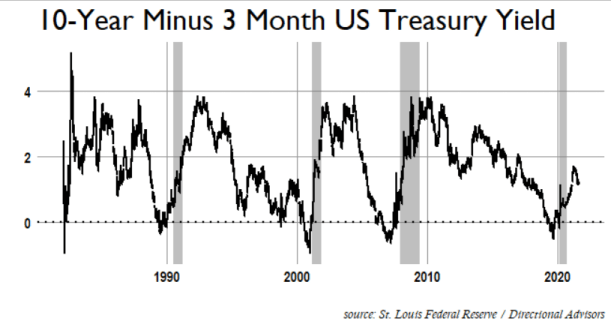
Next, we have the yield curve, one of the most widely-followed recessionary indicators. Normally, investors get paid more to tie up their money for longer. Leading into a recession that relationship inverts, and we get paid more to tie up our cash for shorter periods of time. This indicator has accurately predicted every recession over the past 50+ years. As we can see, this indicator is showing that the economy is in a growth phase.

Another widely-followed indicator is the Headline Unemployment Rate. While the absolute figure is not particularly informative of the business cycle, what we watch for is when the headline rate crosses above its 12-month moving average. When that happens, a recession is typically close at hand. This is now known as Sahm’s Rule after an economist who published a paper a few years ago on the topic. I learned it long before that from an old market veteran. Clearly, the unemployment rate trend is indicating economic growth.

Next we have the Purchasing Manufacturer’s Index, which is an indication of the health of US manufacturing. In this indicator, anything over 50 is expansionary, anything under 50 is recessionary. While we do not always see recessions when PMI is below 50, we have never had a recession when PMI was above 55. Currently, with PMI around 60, manufacturing is going about as well as it ever does. Clearly, PMI indicates an expansionary environment.

Finally, we look at the price of copper. Copper is one of the main commodity inputs to global manufacturing, and its supply is generally pretty responsive to demand changes. Thus, rising copper prices are typically indicative of increased demand for the commodity, reflective of increased global manufacturing. Currently high copper prices appear to be indicative of renewed global demand for manufacturing.

In sum, the macro-economic indicators are showing an economy firmly in an expansionary phase. While there are challenges over the coming months, to be sure, the underlying fundamentals are generally good. If or when this changes, so will my outlook.

This document is a general communication being provided for informational purposes only. It is educational in nature and not designed to be taken as advice or a recommendation for any specific investment product, strategy, plan feature or other purpose in any jurisdiction, nor is it a commitment from Directional Advisors to participate in any of the transactions mentioned herein. Any examples used are generic, hypothetical and for illustration purposes only. This material does not contain sufficient information to support an investment decision and it should not be relied upon by you in evaluating the merits of investing in any securities or products. In addition, users should make an independent assessment of the legal, regulatory, tax, credit, and accounting implications and determine, together with their own financial professionals, if any investment mentioned herein is believed to be appropriate to their personal goals. Investors should ensure that they obtain all available relevant information before making any investment. Any forecasts, figures, opinions or investment techniques and strategies set out are for information purposes only, based on certain assumptions and current market conditions and are subject to change without prior notice. All information presented herein is considered to be accurate at the time of production, but no warranty of accuracy is given and no liability in respect of any error or omission is accepted. It should be noted that investment involves risks, the value of investments and the income from them may fluctuate in accordance with market conditions and taxation agreements and investors may not get back the full amount invested. Both past performance and yields are not reliable indicators of current and future results.

What I Care About This Week | 2021 August 16

by Franklin J. Parker, CFA

The Summary

  • Retail sales, industrial production, and the usual weekly jobless claims post this week. Generally a light data week after last week’s all-important inflation print, but the peek into consumer spending will be important—especially in light of the surge in Covid cases. How consumers are responding is an important consideration in how we can interpret future case numbers. In keeping with the consumer spending theme, Target and Walmart report earnings this week.

  • Earnings season is mostly behind us with over 90% of the S&P 500 companies having reported. According to FactSet, 87% of companies have reported earnings above estimates, and they have reported revenues 4.9% above their expectations, on average. This is the highest beat since FactSet began started tracking the figure in 2008. In short, earnings are very good. That prices haven’t moved much in response is a good sign, in my view, as it means investors are already shrinking stock valuations in expectation of the Fed withdrawing their support. As I have said before, this does not necessarily mean prices will fall so long as earnings growth makes up the difference.

  • Last week was a busy data week. Inflation posted at 5.4%—much hotter than the Fed would like, but less than consensus expectations and less than last month’s print. The Fed is, so far, holding to their “high inflation is transitory” narrative, but many political leaders are sounding alarm bells. As I have said before, we need to watch the data as it comes in rather than hold to a specific narrative. And, exactly how this keeps the Fed in play (or takes them out of play) is yet to be seen. At the moment, I expect the Fed to announce their tapering program in September or October, then begin their tapering program in January of 2022, and conclude it (i.e. stop printing money) by September/October of 2022.

The Details

Let’s talk about growth themes.

In the coming decades, I see technological adoption accelerating in sectors that have been historically resistant or unable to adopt technological solutions. Livestock agriculture (part of my background) is my favorite example of this. While grain farmers have been eager and quick to adopt technology in both the harvesting and planting of crops—self-driving tractors are a real thing!—the crops themselves have also been technologically modified to increase yield.

Livestock agriculture is different, however. Livestock cannot be so readily modified by technology, and automating their growth and harvest is a non-trivial problem. Technology will find its way into the sector, but it has yet to make a significant dent. And, there are numerous sectors like this still out there. I see these late-tech sectors being the target of innovation and growth in the coming decades.

Cryptocurrencies are oft-talked about as part of the future. While I am skeptical of the specific currencies, I am quite bullish on the technology that underlies them. Blockchain technology is, at heart, a digitally stored and verified contract. Any agreement between people could be conducted on a blockchain, so the possibilities are genuinely endless. You can think of blockchain as a foundational technology—it is what other stuff is built upon. This is similar to the internet. While the internet itself is not an investible business, it is foundational to other investable businesses. I see the same as being true for blockchain, and the growth potential in the sector is enormous.

Biotechnology is sure to continue its advance in the coming decades. With the rapid growth of CRSPR’s gene-editing technology, genetic profiling, and bio-printing, there are sure to be breakthroughs in personalized medicine coming. Under a personalized medicine paradigm, therapies, medicines, and treatments are tailored to and built for your specific body and/or disease. One-size-fits-all pills and medical devices are likely to be a thing of the past as we become better able to 3D-print both. There is some ground to cover to get there, not to mention the regulatory hurdles to get clearance from the FDA, but I see innovation and growth in this subsector in the coming decades.

Finally, there appears to be a trend developing in re-shoring manufacturing. Note that these manufacturers will not look like they did in the 1970s. The trend in automation will augment this re-shoring trend, and the providers of manufacturing processes and robotics will likely see growth in the coming decades.

Of course, getting trends right is a separate issue from getting specific company bets right. All of the usual rules apply when we invest in a long-term growth thesis: only invest in companies you understand, and don’t get married to an idea. And none of this to say that buying long-lasting and proven companies is a bad strategy. Rather, an eye to emerging growth trends should only serve to augment what investors are already doing.

Chart of the Week

2021 has seen some talk of a global minimum corporate tax rate. Generally speaking, the G7 countries are now in agreement, at least in concept. Interestingly, this appears to simply be a shot at Ireland who has the only headline tax rate below the proposed minimum, as the first chart demonstrates. This, coupled with a proposed increase in US corporate taxes, has some investors worried.

However, as I have talked about before, the headline tax rate is not the relevant metric. What is relevant is the effective tax rate, which is mostly governed by the details of a nation’s tax code. As the second chart shows, (1) the Biden administration’s proposal keeps corporate tax rates below Obama-era rates (also well below Reagan’s tax rates), and (2) the effective tax rate of US corporations is well below the headline rate, and has been declining precipitously over the years.

In short, at least as so far discussed, a potential increase in corporate tax rates is largely a non-event for investors. While it will increase taxes paid, it will only do so on the margin—not a significant enough dent to make a difference, in my view.

This document is a general communication being provided for informational purposes only. It is educational in nature and not designed to be taken as advice or a recommendation for any specific investment product, strategy, plan feature or other purpose in any jurisdiction, nor is it a commitment from Directional Advisors to participate in any of the transactions mentioned herein. Any examples used are generic, hypothetical and for illustration purposes only. This material does not contain sufficient information to support an investment decision and it should not be relied upon by you in evaluating the merits of investing in any securities or products. In addition, users should make an independent assessment of the legal, regulatory, tax, credit, and accounting implications and determine, together with their own financial professionals, if any investment mentioned herein is believed to be appropriate to their personal goals. Investors should ensure that they obtain all available relevant information before making any investment. Any forecasts, figures, opinions or investment techniques and strategies set out are for information purposes only, based on certain assumptions and current market conditions and are subject to change without prior notice. All information presented herein is considered to be accurate at the time of production, but no warranty of accuracy is given and no liability in respect of any error or omission is accepted. It should be noted that investment involves risks, the value of investments and the income from them may fluctuate in accordance with market conditions and taxation agreements and investors may not get back the full amount invested. Both past performance and yields are not reliable indicators of current and future results.

What I Care About This Week | 2021 August 9

by Franklin J. Parker, CFA

The Summary

  • This week’s data is all about inflation. Consumer inflation expectations post today, headline inflation figures post on Wednesday, and producer prices post on Thursday (producer prices are another way to gauge inflation). Each inflation data point is growing more important as the Fed considers when/how much to begin ending their ongoing support. Other important data this week are figures on productivity (Tuesday) and initial jobless claims (Thursday).

  • Last week’s unemployment report was quite strong. Total jobs added in July came in at 943,000 and the headline unemployment rate dropped from 5.9% to 5.4%. It is important to remember that these figures are always posted with seasonal adjustments. Seasonal adjustments are a statistical technique to remove the predictable fluctuations from the numbers. In July, seasonal adjustments added over 1 million jobs to the figure, so the actual number of jobs in the economy fell by 133,000. Seasonal adjustments have been a source of contention among analysts during the Covid recovery—how much weight should we give them over the actual figure is an open question. In any event, the market appreciated the report.

  • The debt ceiling is yet again in the news. For investors, the debt ceiling is largely a non-event. While the first government shutdown pushed prices around, the second and third one trained markets to shrug off the political brinksmanship, so it is mostly a non-event. The danger to investors is the very small (but nonzero) chance of the US Treasury missing an interest payment on their bonds. A default on US Treasury securities—considered by most the safest securities in the world—would be catastrophic. Therefore, a government shutdown should be on the radar of investors, but it is not worth worrying about… yet.

The Details

“He who does not take into consideration the scarcity of capital goods available is not an economist, but a fabulist.

—Ludwig von Mises, Human Action

Economics is all about tradeoffs. Dedicating resources to one thing necessarily means you cannot dedicate those resources to something else. It is this scarcity of resources that drives any economic system. Whether socialist, capitalist, feudalist, or agrarian, any economic system must deal with the plain fact that resources are scarce. The economists’ crux, then, lies in answering the simple question: how should scarce resources be allocated?

Capitalism has the advantage of private markets which are marvelously efficient allocation machines. Private markets will naturally put resources where they can be of highest use to society. When resources are distributed efficiently and toward their highest use, economic growth is at its peak for that society.

Now, reasonable people can (and often do) disagree about the human ethic of an allocation driven entirely by efficiency. When that is the case a political process can be used to reallocate resources in a way that the populace deems more acceptable. It is not my objective here to argue for or against any particular allocation of resources. This is our system. My job as a professional investor is to play the game on the field, not the game I wish was on the field.

However, just like everything in economics, this reallocation of resources comes with a cost. When we move resources from their highest use toward another use, we necessarily sacrifice peak economic growth. Again, that may be an acceptable tradeoff given other, more human, considerations, but it is a tradeoff, nonetheless.

There are two basic ways politicians can reallocate resources. The first, and most familiar, is taxes. Taxes move resources from one area of the economy to another. Taxes are the most transparent method as it requires a debate about the merits and demerits of a particular allocation.

The second, and less familiar, is money-printing. This method is less transparent, so bear with me a moment while we explore how taxes and money-printing are basically the same thing.

You can think of a dollar like a share in the US economy. When you print more dollars, you simply divide the economy into smaller and smaller pieces, but you don’t actually make the economy bigger. By dividing the economy into smaller pieces, politicians are able to take those newly-created pieces and move them to different areas of the economy. The real advantage is that this can be done without having to go through the politically challenging process of raising taxes. But it is functionally the same thing. Pulling 3% of someone’s net worth in taxes or depreciating the currency by 3% still leaves you with 3% less wealth than you had before.

Printing money is more complicated, however, because a currency is always valued in relation to another currency. If most other economies are also printing money at about the same rate, then there is a dampener on inflationary effects, which is largely what we’ve seen over the past decade.

And all of this brings me to my point. The primary cost to excessive money-printing may not be inflation. The primary cost may be economic growth. By moving resources from their highest use toward another use, we necessarily sacrifice economic growth (because resources are inefficiently allocated). If inflation comes along as a secondary cost (which is possible but not certain), then we have a stagflationary environment until private markets can again allocate resources efficiently.

Japan is my favorite example of this. From 2012 to 2021, Japan’s central bank has expanded their money supply by 529%. Just as a comparison, the US Federal Reserve expanded the US money supply by 266% over the same period—almost half of the Japanese figure. Rather than spark inflation and economic growth as would be traditionally expected, Japan’s economy is only 2.5% bigger today than it was at the beginning of 2012, and Japanese inflation has yet to hit 2% in any year. By comparison, the US economy is almost 20% larger over the same period, and US inflation has just now started to break above the 2% level.

Exactly how the cost of ongoing money-printing will bear out is, I must admit, an open question. As I have said before, the most important value an investor can have in this environment is flexibility. We must take the data as it comes and update our views—being dogmatic about an idea is a sure way to get hurt. More than anything, my point here is to simply open our minds to possibilities other than “printing money = inflation.” As investors, there are alternate costs we must consider.

Because, in the end, economics is all about tradeoffs.

Chart of the Week

In support of my thesis above, I’ve plotted the cumulative change of Japanese Central Bank assets with US Central Bank assets (a good proxy for the change in money supply) along with the cumulative change in Japan’s GDP and the US’s GDP since 2012. US figures are in red, Japanese figures are in blue.

This document is a general communication being provided for informational purposes only. It is educational in nature and not designed to be taken as advice or a recommendation for any specific investment product, strategy, plan feature or other purpose in any jurisdiction, nor is it a commitment from Directional Advisors to participate in any of the transactions mentioned herein. Any examples used are generic, hypothetical and for illustration purposes only. This material does not contain sufficient information to support an investment decision and it should not be relied upon by you in evaluating the merits of investing in any securities or products. In addition, users should make an independent assessment of the legal, regulatory, tax, credit, and accounting implications and determine, together with their own financial professionals, if any investment mentioned herein is believed to be appropriate to their personal goals. Investors should ensure that they obtain all available relevant information before making any investment. Any forecasts, figures, opinions or investment techniques and strategies set out are for information purposes only, based on certain assumptions and current market conditions and are subject to change without prior notice. All information presented herein is considered to be accurate at the time of production, but no warranty of accuracy is given and no liability in respect of any error or omission is accepted. It should be noted that investment involves risks, the value of investments and the income from them may fluctuate in accordance with market conditions and taxation agreements and investors may not get back the full amount invested. Both past performance and yields are not reliable indicators of current and future results.

What I Care About This Week | 2021 Aug 2

by Franklin J. Parker

The Summary

  • Manufacturing and factory order data posts this week. Also posting (on Friday) is the unemployment rate. Investors are very interested in how the economic recovery is progressing, of course, but much of this data will also be viewed in the context of a Fed that is growing impatient with its ongoing support of the economy. Employment, particularly, will be watched closely as it is a key variable cited by the Fed.

  • Corporate earnings have been quite strong for the past three weeks. With 60% of the S&P 500 companies having reported, earnings growth is estimated to be about 85% over last year. Prices have moved only slightly over the past three weeks, indicating that investors have largely priced this in. This sideways movement is also lowering valuations (when earnings increase but prices do not, the ratio of price to earnings decreases), which is a good thing, at least in my view.

  • Last week the Federal Open Market Committee met and decided to leave rates unchanged, which was no surprise. The key question to Chair Powell was when the Fed will begin tapering and ending their $120 billion/month asset purchase program. The Chairman responded that they have yet to reach “substantial further progress” toward their goals of maximum employment. When questioned on inflation, the Chairman again reiterated the committee’s belief that recent high inflation is a transitory phenomenon driven by pandemic-induced supply constraints.

The Details

Photo by Nicholas Githiri on Pexels.com

I’m not sure I’ve ever really laid out my market thesis. Here it is.

Under normal circumstances, I look at the big-picture fundamentals of the US economy to try and understand where we are in the business cycle, and how we might best allocate our investable dollars. The objective is to put out full sail when the wind is with us, and to avoid the storms where we can. Of course, these fundamentals exert an influence over the economy, they never give you a perfect picture of exactly what is about to happen. So, while I cannot tell you when the first drop of rain might fall, I can usually tell if there is a storm on the horizon.

In this environment there has been only one economic variable that has mattered: the Federal Reserve. Their response to the Covid recession served to offset the worst of the pain in asset prices. Of course, the Federal Reserve would like to end their support soon, so more traditional economic fundamentals are going to begin to matter again.

My view is that you have two “dials” at work in this environment. One dial is economic fundamentals—the things that usually matter. The other dial is the Federal Reserve. The Fed’s dial has been turned up to 11 for the past 18 months, but as they turn that dial back down, we ought to again “hear” the influence of economic fundamentals.

We are, then, entering a transitionary environment where the influence of the Fed will be waning and the influence of economic fundamentals will be waxing. Investors will need to discern, as best they can, how much influence one dial has vs the other in any given moment. Not an easy ask, to be sure.

For the next six months, however, I see both the Fed and the economic fundamentals keeping an upward bias in prices.

Chart of the Week

The key restriction on the Federal Reserve is inflation. Historically, inflation and employment have been linked: as the economy reaches full employment, inflation tends to increase, and as employment falls inflation tends to decrease. This relationship has been largely broken for the past 20 years, however, and the Fed has struggled to construct a narrative around why (globalization appears to be the central factor).

At any rate, with employment still well below levels the Fed would like to see, inflation is hitting pretty high levels. Producer prices, which are typically seen as an early indication of future inflation, have increased 7.1% over last year. Core prices (excluding food and energy) are up over 4% from last year. If you count food and energy (and for most households, food and energy are big expenses), prices are up 5.3% over last year.

As I see it the Fed will be quite eager to pull back from their money-printing just as soon as the labor market has recovered to acceptable levels. This makes each month’s inflation and employment report increasingly important, and the exact timing of the transition will be important to investors.

This document is a general communication being provided for informational purposes only. It is educational in nature and not designed to be taken as advice or a recommendation for any specific investment product, strategy, plan feature or other purpose in any jurisdiction, nor is it a commitment from Directional Advisors to participate in any of the transactions mentioned herein. Any examples used are generic, hypothetical and for illustration purposes only. This material does not contain sufficient information to support an investment decision and it should not be relied upon by you in evaluating the merits of investing in any securities or products. In addition, users should make an independent assessment of the legal, regulatory, tax, credit, and accounting implications and determine, together with their own financial professionals, if any investment mentioned herein is believed to be appropriate to their personal goals. Investors should ensure that they obtain all available relevant information before making any investment. Any forecasts, figures, opinions or investment techniques and strategies set out are for information purposes only, based on certain assumptions and current market conditions and are subject to change without prior notice. All information presented herein is considered to be accurate at the time of production, but no warranty of accuracy is given and no liability in respect of any error or omission is accepted. It should be noted that investment involves risks, the value of investments and the income from them may fluctuate in accordance with market conditions and taxation agreements and investors may not get back the full amount invested. Both past performance and yields are not reliable indicators of current and future results.

What I Care About This Week | 2021 July 26

by Franklin J. Parker, CFA

The Summary

  • It is Fed week! The Federal Open Market Committee meets on Tuesday/Wednesday, and is expected to announce their monthly rate decision on Wednesday. The expectation is for no rate move at this meeting, but it will be the commentary and press conference from chairman Powell that markets will watch with baited breath. Investors are eager to hear the timing of the Fed’s end to money-printing, which the Fed has so far been unable to give.

  • Earnings continue, and the news is generally good. About 100 of the S&P 500 companies have reported earnings for Q2, and almost all of those have beaten their earnings expectations. Earnings growth over last year is expected to be around 75%, which is very good. Of most interest to investors, however, is earnings guidance from CEOs, which has been largely suspended since the pandemic began. Only a few companies have even given guidance for Q3, but of those most of the guidance has been positive. The resumption of earnings guidance would be a signal that things are returning to normal—itself a positive sign.

  • This week is a pretty heavy data week. We continue to get corporate earnings, the Fed will be watched closely, durable goods orders post and will give some indication of the health of supply chains and corporate confidence, initial jobless claims will signal whether the pandemic is still dragging on employment, and consumer spending figures on Friday will give us a read on whether the consumer recovery is still in effect. In all, this is a busy week!

The Details

What are SPACs, and should you invest in them?

SPAC is an acronym for Special Purpose Acquisition Company. SPACs have been in the news over the past couple of years as their popularity and successes have gained momentum. They are a very simple construct: essentially the SPAC sponsor (usually a group with some specific industry knowledge) raises investor money by listing an empty company on an exchange. The investors do not know which company will be acquired, only that they trust the SPAC sponsor enough to pick one.

Once the SPAC sponsor identifies a target company, they use their cash to purchase the private company and the private company is now publicly traded.

The advantages to the private company are pretty obvious: they do not have to go through the hassle and expense of a more traditional IPO offering. Thus, they can exit sooner than they otherwise would. The SPAC sponsor usually retains significant ownership in the public shares, plus they get paid an ongoing management fee, and the investors get to own a company that would normally still be closely-held at that stage.

One high-profile example was the 49%, $800 million, stake taken in Virgin Galactic by a SPAC called Social Capital Hedosophia Holdings. This SPAC was put together and sponsored by silicon valley venture capitalist Chamath Palihapitiya.

SPACs, then, are a bit of a blend between public stocks and private equity (or venture capital). Because of that blended nature, investors should not think of SPACs as part of a typical stock portfolio. SPACs should receive only capital that is earmarked for higher risk investments. That is not to say that they cannot be part of an overall portfolio, rather, investors should not view them as some magical thing that reliably generates cash.

Just like any other investment, due diligence and a clear understanding of the risks are warranted.

Chart of the Week

This week’s chart comes from FactSet and shows the average size of earnings beats by sector. The financial sector has seen the largest upside surprise, followed by Consumer Discretionary. The results of financials have surprised me a bit—with interest rates near 0%, it is very difficult to earn profits via traditional banking. To that point, much of the earnings growth in the big banks has been through capital markets work: bringing companies public or underwriting debt, etc. Regional banks, however, do not have those luxuries and have been squeezed in the recent market environment.

This document is a general communication being provided for informational purposes only. It is educational in nature and not designed to be taken as advice or a recommendation for any specific investment product, strategy, plan feature or other purpose in any jurisdiction, nor is it a commitment from Directional Advisors to participate in any of the transactions mentioned herein. Any examples used are generic, hypothetical and for illustration purposes only. This material does not contain sufficient information to support an investment decision and it should not be relied upon by you in evaluating the merits of investing in any securities or products. In addition, users should make an independent assessment of the legal, regulatory, tax, credit, and accounting implications and determine, together with their own financial professionals, if any investment mentioned herein is believed to be appropriate to their personal goals. Investors should ensure that they obtain all available relevant information before making any investment. Any forecasts, figures, opinions or investment techniques and strategies set out are for information purposes only, based on certain assumptions and current market conditions and are subject to change without prior notice. All information presented herein is considered to be accurate at the time of production, but no warranty of accuracy is given and no liability in respect of any error or omission is accepted. It should be noted that investment involves risks, the value of investments and the income from them may fluctuate in accordance with market conditions and taxation agreements and investors may not get back the full amount invested. Both past performance and yields are not reliable indicators of current and future results.