What I Care About This Week | 2022 Feb 21

by Franklin J. Parker, CFA

The Summary

  • All eyes are on the Russia-Ukraine standoff. Meanwhile, this week, the march of data continues. Consumer confidence and PMI data post tomorrow. Jobless claims post on Thursday with personal incomes on Friday. All of these data points are important, especially initial jobless claims, which have ticked up recently. So far, the economy has remained fairly robust in the face of inflation and ongoing covid concerns. With the landscape rapidly shifting, however, investors are closely watching for a potential slowdown.

  • Earnings season is coming to a close with 90% of the S&P 500 companies having reported. It is generally good news, with 78% of companies reporting earnings above expectations. In summary, the S&P 500 is on track to post 31% earnings growth, year-over-year. Technology, despite all of the hubub, has posted the most beats, and utilities have posted the fewest. Inflation is a hot topic on earnings calls, and remains a wildcard in coming quarters.

  • My portfolio view has not shifted. I still see a rocky first half to 2022, with the drawdown likely lasting another 3 to 5 months, and possibly reaching down 15% to 20% from the recent highs in the S&P 500. The Fed has been a bit confusing in their messaging lately. There is talk of raising rates by 0.50% in March, though that has not previously been on the table. For investors, the Fed meeting in March represents a significant event, and is likely to push prices around—as are the few meetings after. Once markets have digested the new backdrop, I see a return to growth in the back half of the year.

The Details

I (and many others) have talked extensively about the rise of so-called “zombie companies” in recent years. Though there is no standard definition, a Federal Reserve report defines a zombie company as (1) does not make enough money to cover the cost of their debts, and (2) has negative sales growth. In other words, zombie companies have to constantly consume new investor capital to stay alive.

One consequence of Fed policy over the past 15 years has been to make it considerably easier for zombie companies to survive. That Fed report also shows that about 9% of publicly-traded companies in the US is a zombie firm (I have seen other reports that put the figure closer to 20%). Since these firms tend to be highly leveraged and dependent on ongoing easy money, these firms stand to lose the most (all?) as leverage becomes more expensive and easy cash begins to dry up.

To date, investors have been content to back companies with a strong narrative—even if cash and sales have been in short supply. We can expect this willingness to diminish as the Fed abruptly changes course. Investors would do well to ensure that firms like this are not significant holdings in their portfolios.

Chart of the Week

This week’s chart is our final look at earnings for Q4 2021. With most companies having reported, the results are generally quite good. The S&P 500 has posted an average upside surprise of 5.5%, with technology representing the largest average beats. Energy has also done quite well, though. In sum, earnings season has been positive. Coming quarters, however, may be more challenging as rising input costs begin to eat away margins.

This document is a general communication being provided for informational purposes only. It is educational in nature and not designed to be taken as advice or a recommendation for any specific investment product, strategy, plan feature or other purpose in any jurisdiction, nor is it a commitment from Directional Advisors to participate in any of the transactions mentioned herein. Any examples used are generic, hypothetical and for illustration purposes only. This material does not contain sufficient information to support an investment decision and it should not be relied upon by you in evaluating the merits of investing in any securities or products. In addition, users should make an independent assessment of the legal, regulatory, tax, credit, and accounting implications and determine, together with their own financial professionals, if any investment mentioned herein is believed to be appropriate to their personal goals. Investors should ensure that they obtain all available relevant information before making any investment. Any forecasts, figures, opinions or investment techniques and strategies set out are for information purposes only, based on certain assumptions and current market conditions and are subject to change without prior notice. All information presented herein is considered to be accurate at the time of production, but no warranty of accuracy is given and no liability in respect of any error or omission is accepted. It should be noted that investment involves risks, the value of investments and the income from them may fluctuate in accordance with market conditions and taxation agreements and investors may not get back the full amount invested. Both past performance and yields are not reliable indicators of current and future results.

What is a Bubble, Exactly?

What is a bubble, exactly?

This may be a silly question to ask, I admit. Everyone knows what a bubble is, right? Yet in my experience, other than someone simply declaring “that’s a bubble,” I have yet to find firm definition of what actually makes a bubble. That is an important point in my mind because simply declaring “that’s a bubble” (1) does not help us understand how the bubble formed and what may cause it to pop, nor (2) does it make me at all confident that this person is correct! I am a “show me your work” kind of guy. I’m not one to accept someone’s declaration as fact.

What’s more, there is a whole line of economic thought that denies the concept of “a bubble” even exists! Nobel-laureate Eugene Fama famously said, “I don’t even know what a bubble means. These words have become popular. I don’t think they have any meaning.” To be fair to Fama, his point is that the concept is only useful if it helps to make good predictions and you can profit from it. He does not believe the evidence shows that bubble theories are useful for either.

There are some loose frameworks for thinking about bubbles. Of all the bubble theories with which I am familiar a geophysicist, Didier Sornette, applied some earthquake theory to financial markets with reasonable success. Sornette’s bubble theory has the advantage of explicit predictions—he claims to be able to forecast when bubbles will pop to within a few days! (For those less quantitatively inclined, his institute for financial risk at ETH Zurich posts a monthly bubble report that I myself review every month).

Despite its history and obvious utility, I remain skeptical of Sornette’s bubble theory. Just like any other tool in financial markets, there are times it seems to work and times it doesn’t. It is, I think, best used in a mix of tools.

And therein lies my trouble. There is no “mix of tools” when it comes to bubbles.

So, here is my loose framework for thinking about bubbles. There is an important quantitative component which I won’t bore you with here, but an understanding of just the framework is helpful I think.

I think our intuition of bubbles is pretty simple, and can help us with a working definition: something is a bubble when it is fragile with respect to some input. So, for example, through 2001 to 2007, housing prices became fragile with respect to poor underwriting and the proliferation of derivatives. Admittedly, these were obscure inputs to spot, but some financial professionals did spot that fragility and bet on it breaking well in advance of the broader marketplace.

What I like about this definition is that it is about something other than price. Prices going up may or may not be the sign of a bubble. Even if price increases are a symptom of a bubble, that does not help us understand how/why/when the bubble might pop (and prices go down). By focusing on the inputs, we can focus on the underlying problem rather than the symptoms.

This definition also helps us find the source of fragility. Doing a cursory analysis on housing prices in 2006/2007 would not have yielded a satisfying answer—it wasn’t really interest rates or housing supply that was driving the boom, and that should push a dedicated analyst to dig deeper. Once the problem of underwriting and derivatives were found, the source of fragility would be clearer and the analyst could watch those signals for signs of weakness, and thus be prepared for the popping of the bubble.

Financial markets today are quite fragile with respect to economic policy—and have been for the past decade. Markets are generally hooked on the federal reserve and ever-lowering interest rates. This has driven prices across all asset classes ever higher, and created a systemic problem. When the bubble pops, everything pops together.

This means that investors should watch these sources of fragility very, very closely. And remember, prices can stay absurd for a very, very long time. Japan is a good example. They have been running this economic experiment for about 30 years, and it is still going. Most investors simply cannot sit on the sidelines for their entire professional life waiting for a bubble to pop. Thus, understanding the source of the bubble can also give nervous investors confidence to step into financial markets, with an understanding that backing away may be appropriate if the system begins to crack.

As always, this is something we would be delighted to chat about with you.

This document is a general communication being provided for informational purposes only. It is educational in nature and not designed to be taken as advice or a recommendation for any specific investment product, strategy, plan feature or other purpose in any jurisdiction, nor is it a commitment from Directional Advisors to participate in any of the transactions mentioned herein. Any examples used are generic, hypothetical and for illustration purposes only. This material does not contain sufficient information to support an investment decision and it should not be relied upon by you in evaluating the merits of investing in any securities or products. In addition, users should make an independent assessment of the legal, regulatory, tax, credit, and accounting implications and determine, together with their own financial professionals, if any investment mentioned herein is believed to be appropriate to their personal goals. Investors should ensure that they obtain all available relevant information before making any investment. Any forecasts, figures, opinions or investment techniques and strategies set out are for information purposes only, based on certain assumptions and current market conditions and are subject to change without prior notice. All information presented herein is considered to be accurate at the time of production, but no warranty of accuracy is given and no liability in respect of any error or omission is accepted. It should be noted that investment involves risks, the value of investments and the income from them may fluctuate in accordance with market conditions and taxation agreements and investors may not get back the full amount invested. Both past performance and yields are not reliable indicators of current and future results.

What I Care About This Week | 2022 Feb 14

by Franklin J. Parker, CFA

The Summary

  • Lots of big news swirling around. First, tensions at the Russia-Ukraine border have intensified, with US officials warning today that military action may begin within the next few days. This has created significant jitters in markets, as a Russian invasion of Ukraine generates significant uncertainty around a US response. Though a military option is not on the table, the Biden administration has repeatedly said that targeted and painful sanctions are. As we have discussed here before, however, sanctions are painful to everyone, not just the target. Investors, at any rate, are in a wait-and-see mode.

  • Inflation posted last week at the highest level in 40 years, a startling 7.5% (though economists were expecting a 7% rise). This has pushed investors to reevaluate the path of Fed rate hikes and monetary policy. St. Louis Federal Reserve president Bullard threw gasoline on that fire with his comments that he sees the Fed raising rates by half a percent in March, with a full percentage point increase by summer. This was a shock to markets as it represents a significantly more aggressive stance than previously expected. I see the Fed as unlikely to follow such a path, though recent inflation figures suggest that it is warranted.

  • Earnings season continues to be fairly good, of the 72% of S&P 500 companies that have reported, over three-quarters of those have beaten expectations. Revenue growth has been quite good, but inflation is a hot topic on earnings calls. Inflation can be expected to erode profit margins over time: as companies begin losing pricing power in the marketplace, they are forced to eat their higher costs, which hurts profits over time. Investors will be watching closely in coming quarters to see how bad inflation is compressing margins—to date, companies have been able to increase prices to keep margins steady.

  • My investment outlook has not shifted. It is still my view that we have a bit more downside to go, though I will readily admit that judging short-term swings is very very difficult. Inflation and the Fed are likely to keep volatility elevated over the coming six months. As I have said before, I do not yet see this as a recession and this downswing is likely to be short-lived, in my view. In the end, exactly how you position your portfolio is dependent on your goals, time horizon, and willingness to watch your statement value move.

The Details

I listened to a very interesting interview with Ryan Peterson, CEO of Flexport, last week on the All In podcast. There were several eye-opening points made about the current and future state of our supply chains, two of which were particularly concerning.

First, and most concerning: ports along the entire west coast of the US, Mexico, and Canada are operated by a single union, the International Longshore and Warehouse Union. As it turns out, their contract expires in July of 2022, and the last time their contract expired, there were severe disruptions to shipping. With ports already overloaded, disruptions this year could be catastrophic. The Wall Street Journal reported back in November that the union appears to be ready to dig in.

Second, the international maritime regulatory body (which sits under the United Nations umbrella) will require every fossil-fueled ship to reduce emissions by 13%, starting in January 2023. Of course, most ships cannot simply flip a switch to make that happen, and many of the technological innovations to reduce emissions have already been brought to bear. The only real way to immediately accomplish this objective is to reduce the speed of the ship, which, in turn, reduces emissions but also reduces the number of trips available within the same period of time.

Both of these points are enough to generate concern that our supply-chain woes have not yet peaked. Investors should keep a close eye on both developments and make provisions accordingly.

Chart of the Week

This week we look at an interesting graphic produced by Reuters detailing current Russian military positions, and possible paths of invasion into Ukraine. I must admit my amateurishness in this area, so I will refrain from commenting on possible motives and objectives of the Russian Federation. In the end, I am left to watch the events unfold along with everyone else, though some risk control here is warranted. War is an unpredictable thing, and with US/NATO troops all around Ukraine the risk of a wider conflict is not zero.

This document is a general communication being provided for informational purposes only. It is educational in nature and not designed to be taken as advice or a recommendation for any specific investment product, strategy, plan feature or other purpose in any jurisdiction, nor is it a commitment from Directional Advisors to participate in any of the transactions mentioned herein. Any examples used are generic, hypothetical and for illustration purposes only. This material does not contain sufficient information to support an investment decision and it should not be relied upon by you in evaluating the merits of investing in any securities or products. In addition, users should make an independent assessment of the legal, regulatory, tax, credit, and accounting implications and determine, together with their own financial professionals, if any investment mentioned herein is believed to be appropriate to their personal goals. Investors should ensure that they obtain all available relevant information before making any investment. Any forecasts, figures, opinions or investment techniques and strategies set out are for information purposes only, based on certain assumptions and current market conditions and are subject to change without prior notice. All information presented herein is considered to be accurate at the time of production, but no warranty of accuracy is given and no liability in respect of any error or omission is accepted. It should be noted that investment involves risks, the value of investments and the income from them may fluctuate in accordance with market conditions and taxation agreements and investors may not get back the full amount invested. Both past performance and yields are not reliable indicators of current and future results.

What I Care About This Week | 2022 Feb 07

by Franklin J. Parker, CFA

The Summary

  • Payrolls for January posted last week. It was, on the surface, a good jobs report with 467,000 jobs added in January—considerably higher than most analysts expected. However, a change to how seasonal adjustments are applied did give a boost to the figure than we may have otherwise seen. Markets, in response to the strong figures, have begun to price five rate hikes from the Fed, which is more than the Fed itself sees for 2022.

  • Interest rates have begun to bump up against some key levels. The 10-year treasury yield is now hovering around 1.9% and all of the expected cracks have begun to appear amongst high-flying tech names (and the new listings that are reliant on cheap capital). Inflation figures for January post on Thursday. 7.3% appears to be the expectation, which is still stubbornly high. With inflation in the crosshairs of the Fed, this print could easily push markets around.

  • Rhetoric and actions surrounding the Russia-Ukraine standoff are adding to uncertainty. The US has sent troops to reinforce the area around Ukraine (though not in Ukraine itself), and talk of intense sanctions on Russia have grown. In last week’s report, I discussed the challenges of sanctions for investors so I won’t repeat them here. Suffice it to say, economic pain can be inflicted in both directions and investors should be prepared.

  • Earnings season continue, and the news is generally good. Earnings growth has slowed a bit, and there is a big bifurcation: companies that are reporting profits seem to be reporting strong profits while poor reports seem to be very bad. Most notably, Meta, the parent company of Facebook, was severely punished after their lackluster earnings report—logging the largest 1-day loss in value of any company ever. This is, of course, adding to volatility in markets, as investors weigh earnings against the actions of the Fed. As I have said before, I expect this drawdown to be short-lived (though I do not yet believe we are at the bottom) and a good opportunity to deploy cash.

The Details

One of the first papers that was published on goals-based investing (though it wasn’t called that at the time) was on the effects of taxes in a portfolio.* The authors demonstrated that active trading strategies, even if they deliver better risk-adjusted returns, are often not good enough to overcome the tax drag they can create. In other words, it may look good on a statement, but not so good when the tax man cometh.

Seems strange to say now, but that one should account for taxes in an investment strategy was a new concept in 1993! In any event, it is just as relevant today as then, and our current market environment is a reminder of this.

I have, for months, talked about the likelihood of a selloff in the face of changing Federal Reserve priorities. Exactly how portfolios were prepared for this selloff, however, had as much to do with each client’s tax situation and financial goals as it did my view of the selloff itself. For short-lived selloffs, it is often not profitable to sell highly-appreciated positions to reset at slightly lower prices. The taxes on those sales often erodes the benefits of active management, no matter how accurate that active management may be.

There are moments, of course, when it is worth the tax cost.

The point is simply this: taxes are a critical factor in your investment strategy. They must be accounted for. Taxes are also highly individualized, so it can easy to disregard these variables in a general strategy. That is, in my view, a mistake. Keep an eye on tax costs.

*Jeffrey, R., and R.D. Arnott (1993) “Is Your Alpha Big Enough to Cover Its Taxes?” Journal of Portfolio Management, DOI: https://doi.org/10.3905/jpm.1993.710867.

Chart of the Week

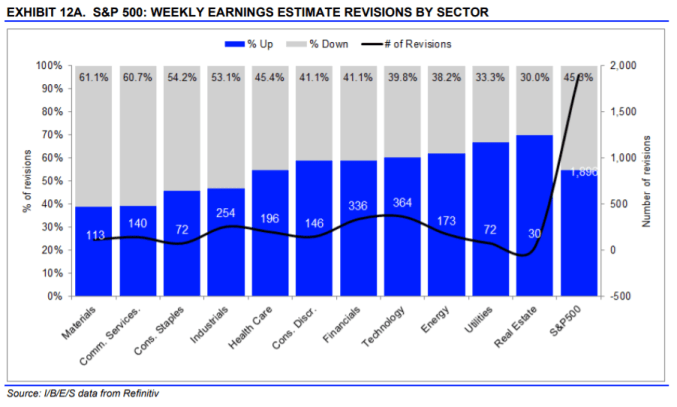
This week we check-in on corporate earnings. As a whole, the S&P 500 has had 77% of reported companies beat expectations, with an average surprise of 4%. Of the companies that have reported, tech has had the most companies beat expectations (communications have only had 5 earnings reports, so I discount their 100% above expectations figure).

In sum, this is turning out to be a pretty good earnings quarter for US companies. Outlooks have shifted, however, with some sectors seeing considerably more downward revisions than upward (materials, for example). Even still, as a whole, the S&P 500 is seeing more upward revisions in expected earnings than downward.

This document is a general communication being provided for informational purposes only. It is educational in nature and not designed to be taken as advice or a recommendation for any specific investment product, strategy, plan feature or other purpose in any jurisdiction, nor is it a commitment from Directional Advisors to participate in any of the transactions mentioned herein. Any examples used are generic, hypothetical and for illustration purposes only. This material does not contain sufficient information to support an investment decision and it should not be relied upon by you in evaluating the merits of investing in any securities or products. In addition, users should make an independent assessment of the legal, regulatory, tax, credit, and accounting implications and determine, together with their own financial professionals, if any investment mentioned herein is believed to be appropriate to their personal goals. Investors should ensure that they obtain all available relevant information before making any investment. Any forecasts, figures, opinions or investment techniques and strategies set out are for information purposes only, based on certain assumptions and current market conditions and are subject to change without prior notice. All information presented herein is considered to be accurate at the time of production, but no warranty of accuracy is given and no liability in respect of any error or omission is accepted. It should be noted that investment involves risks, the value of investments and the income from them may fluctuate in accordance with market conditions and taxation agreements and investors may not get back the full amount invested. Both past performance and yields are not reliable indicators of current and future results.

What I Care About This Week | 2022 Jan 31

by Franklin J. Parker, CFA

The Summary

  • The Fed delivered a mixed message last week. On the one hand, guidance hasn’t changed: money-printing is set to end in March, and rates are to stay low until the money-printing is done. On the other hand, there is a growing consensus that March will see at least a 0.25% rate hike, and possibly even a 0.50% rate hike. Powell also acknowledged the challenge with managing the Fed’s balance sheet, and though he did not explicitly say this, I got the sense that the Fed would wait until about mid-summer to begin shrinking their balance sheet. All of this means that the Fed will be a dominant and downward force on market prices until probably August/September of this year, and that will be in a tug-of-war with economic fundamentals, which are improving as evidenced by last week’s GDP print for Q4, which posted at a blockbuster 6.9% (5.5% was expected).

  • Personal consumption expenditures decreased slightly for December, posting in-line with expectations. PCE is the Fed’s preferred inflation gauge. With a modest decrease—the lowest print since Feb 2021—markets took this as a glimmer of hope that inflation may be peaking. I remain unconvinced, as this is likely just driven by slowing consumer demand rather than slowing price increases. Recall, my wildcard risk for 2022 is inflation as it can push an economy into a recession by stunting capital expenditures and consumer spending.

  • This week we get some insight on the health of manufacturing and services with PMI data. A reading of the labor market, we get JOLTS job openings data and the usual weekly print of initial jobless claims (though that figure has become less important in recent months), and the headline unemployment rate for Jan. All of these are important data points. I am watching closely for clues on the health of the overall economy, and all of these figures are key on that front.

The Details

The Wall Street Journal reported today that Ukraine-Russia tensions have pushed up wheat prices (though it does appear the upward trend began years ago). I have been talking about my concern for increased tensions for the past few months. But, how concerned should investors be from the perspective of their portfolios?

First and most important: markets do not like uncertainty. War (or a regional conflict) is among the most uncertain things that markets can experience. In general, then, the potential for hostile actions simply adds to volatility and will tend to depress prices.

That said, it appears unlikely that the US and her allies would risk an open war with a nuclear-armed Russia. It has been the policy of the United States to avoid open wars with nuclear states at all costs. Though I must admit my non-expertise in this area, I see a US war with Russia as a very low-probability scenario.

Even if the US and her allies are not involved, hostilities still disrupt the lives of millions of people, cut off trade routes, and disrupt production in the areas around the conflict. This is obviously bad for economic activity.

Furthermore, the US and her allies have indicated they would impose crippling sanctions on Russian oligarchs as well as Russia herself. While US trade with Russia is relatively insignificant (Russia is the US’s 26th largest trading partner with about $35 billion in goods traded per year), Russian trade with the European Union is much more significant. Russia is the EU’s 5th largest trading partner (and the EU is Russia’s largest trading partner). More importantly, Russia supplies over a third of the natural gas used by the EU.

In other words, sanctions, though painful to Russia, are also painful to Europe. Europe is already struggling with economic growth and inflation, and sanctions are sure to exacerbate those problems. This regional conflict, then, could be the straw that breaks the camel’s back, pushing Europe into a recession.

Chart of the Week

Market volatility is back! Although, much of what we have seen is normal, we just forgot because the Federal Reserve has been pulling volatility from markets for the past decade. The recent bounce in markets has led some to question whether the selloff is over. While it is very, very hard to predict these things, my view is that we have a bit more downside to go.

In the chart below, I have plotted my baseline case for the S&P 500. I expect March/April to be the bottom, and I expect the S&P 500 to be down 15% to 20% at the bottom. It is not uncommon to see a bounce after hitting an important milestone (down 10%), but there is still significant overhead resistance for markets around the 4500 level. Unless markets push above that level with some conviction, I do not believe the recent bounce has escape velocity.

Again, short-term swings are notoriously hard to predict, so I may well update my view as new data and market action comes in.

S&P 500 Index, Current and Outlook

This document is a general communication being provided for informational purposes only. It is educational in nature and not designed to be taken as advice or a recommendation for any specific investment product, strategy, plan feature or other purpose in any jurisdiction, nor is it a commitment from Directional Advisors to participate in any of the transactions mentioned herein. Any examples used are generic, hypothetical and for illustration purposes only. This material does not contain sufficient information to support an investment decision and it should not be relied upon by you in evaluating the merits of investing in any securities or products. In addition, users should make an independent assessment of the legal, regulatory, tax, credit, and accounting implications and determine, together with their own financial professionals, if any investment mentioned herein is believed to be appropriate to their personal goals. Investors should ensure that they obtain all available relevant information before making any investment. Any forecasts, figures, opinions or investment techniques and strategies set out are for information purposes only, based on certain assumptions and current market conditions and are subject to change without prior notice. All information presented herein is considered to be accurate at the time of production, but no warranty of accuracy is given and no liability in respect of any error or omission is accepted. It should be noted that investment involves risks, the value of investments and the income from them may fluctuate in accordance with market conditions and taxation agreements and investors may not get back the full amount invested. Both past performance and yields are not reliable indicators of current and future results.

What I Care About This Week | 2022 Jan 24

by Franklin J. Parker, CFA

The Summary

  • It appears the correction is here. It is a bit sooner than I expected, but it is, so far, well within the view that I have been expressing for some months. As I mentioned then, and I reiterate now, I do not see this as a recession. Rather, investors are pricing-away the influence of the Federal Reserve and positioning for interest rate hikes. I see a 15% to 20% total drawdown lasting four to six months. Given that forecast, we are likely about halfway down already. Of course, there are “tails” to this forecast: there are scenarios which could yield considerably more downside and lasting for much longer. Inflation is a major wildcard as it could easily trigger a recession if left unchecked.

  • Momentum is building for a confrontation with Russia over Ukraine. Rhetoric on both sides has grown more heated, and Biden specifically addressed the issue in his press conference last week, saying that the US would meet any Russian incursion with some proportional response. Sanctions are on the table, but many allies have pushed back as it would limit their ability to buy Russian natural gas and other resources. In any event, geopolitical instability is always a risk to markets, especially when a nuclear state is involved. As I have discussed before, there is a second-order effect: the CCP is surely watching the US response as a clue on what to expect regarding the US response to Taiwan. Taiwan is a much more important trading partner with the US, and could heavily influence markets—especially technology.

  • This week, all investor eyes will be on the Federal Reserve. Although no policy change is expected, Powell’s press conference will be watched for clues on the timing and extremity of rate hike expectations. Markets have priced-in more rate hikes than the Fed expects, so there is some possibility that an overreaction is in the works. Consumer sentiment data posts this week. After recent disappointing retail sales data, how consumers are coping with higher prices and omicron will be important.

The Details

Diversification means always being disappointed.

This is an important point to remember. In a portfolio that is well diversified, varying risk exposures means that something is always underperforming, It means that we could always have “done better” if we had simply allocated everything to the best performing asset. Of course, knowing which will be the best performer ahead of time is difficult, but more importantly, best performers tend to become worst performers with little to no warning.

The current correction is a perfect demonstration. While markets are selling off more-or-less in tandem, technology shares—previously the top performers—are selling off much harder than the market more broadly. In 2020, energy, for example, returned practically nothing while technology returned over 50%. 2021 saw a reversal of those fortunes, however, with technology returning about 20% and energy returning 37%, or almost double.

Diversification, however, gives us some very real benefits.

First, when we rebalance a diversified portfolio, we are automatically buying low and selling high. Taking our energy vs. tech example: rebalancing to a 50%/50% allocation at the end of 2020 would have us sell our tech positions that had grown to be 60% of the portfolio. By selling down tech and buying energy, we would have positioned ourselves to buy the outperformer in 2021. We sold tech at a high and bought energy at a low.

Second, a diversified portfolio helps insure that we are not making bets on positions or risk premiums that may underperform for long periods of time. There are long stretches where certain risks simply do not pay off. By capturing more of these risk premiums, we need not be as accurate in our forecasts and we have much more room for error.

Third, investing is often about surviving to another day. In moments of market stress, not holding only one type of risk significantly reduces the damage done. Diversification helps ensure our long-term viability.

While diversification means you’ll always be disappointed, it is also gives us our best chance of achieving long-term goals. Especially in the midst of market turbulence, diversification plus rebalancing is critical to our portfolio strategy.

Chart of the Week

One of the stories of 2021 was the large divergence between growth and value. Value ran ahead toward the beginning of the year, but then growth surged ahead toward the end of the year. Now, beginning in 2022, growth is again lagging. I expect that growth will continue to lag in the face of higher rates, while value may be in a position to pull ahead. This week’s chart demonstrates the difference in performance between growth and value—greater than 0% indicates the outperformance of growth, and less than 0% indicates the outperformance of value.

Historically value outperforms growth, over time and on average. However, a heavy focus on value tends to exclude the economic innovators. I do believe in allocating to value companies, but long-term investors are likely to do well also allocating to innovators, despite the increased volatility. The current dip may give investors an opportunity to allocate at better prices.

Performance of Growth vs. Value

This document is a general communication being provided for informational purposes only. It is educational in nature and not designed to be taken as advice or a recommendation for any specific investment product, strategy, plan feature or other purpose in any jurisdiction, nor is it a commitment from Directional Advisors to participate in any of the transactions mentioned herein. Any examples used are generic, hypothetical and for illustration purposes only. This material does not contain sufficient information to support an investment decision and it should not be relied upon by you in evaluating the merits of investing in any securities or products. In addition, users should make an independent assessment of the legal, regulatory, tax, credit, and accounting implications and determine, together with their own financial professionals, if any investment mentioned herein is believed to be appropriate to their personal goals. Investors should ensure that they obtain all available relevant information before making any investment. Any forecasts, figures, opinions or investment techniques and strategies set out are for information purposes only, based on certain assumptions and current market conditions and are subject to change without prior notice. All information presented herein is considered to be accurate at the time of production, but no warranty of accuracy is given and no liability in respect of any error or omission is accepted. It should be noted that investment involves risks, the value of investments and the income from them may fluctuate in accordance with market conditions and taxation agreements and investors may not get back the full amount invested. Both past performance and yields are not reliable indicators of current and future results.

What I Care About This Week | 2022 Jan 18

by Franklin J. Parker, CFA

The Summary

  • Inflation is the hot topic, with producer prices and headline inflation both posting very strong readings last week. This increases the likelihood of the Fed raising rates at their March meeting. Also—and this was a big disappointment—retail sales posted considerably weaker than expected for December calling into question the strength of earnings season. Weak retail sales may also indicate that consumers are beginning to feel inflation’s pinch—a bad omen if they continue.

  • Russian rhetoric over Ukraine has grown more intense, claiming that talks have “hit a dead end” all while Poland warns European leaders that the risk of war has gown. While not a direct market concern, threats to geopolitical stability significantly increase the uncertainty that currently hangs over market prices. Russia’s leverage over Europe is, of course, its supply of natural gas. Prices have varied wildly since tensions began, but the strength of that leverage should wane once winter passes.

  • From a portfolio perspective, I have grown increasingly pessimistic. Markets have less and less to look forward to, and the Fed’s commentary has grown much more hawkish over recent weeks (especially in light of recent inflation and employment figures). I maintain that this does not look to be the end of the cycle, but I do think the risk of a significant correction in the next month or two has grown. As I have always said, however, how you position your portfolio will be dictated by your goals.

The Details

Much of the upward momentum we enjoyed coming out of 2020 has been spent, and markets are now fighting for every upward step. Of course, the main portfolio challenge is that bonds and stocks are struggling together, so the benefits of diversification are significantly lessened.

There are diversifiers, however. In an inflationary environment, energy tends to outperform as do most commodities (especially food-based commodities, like corn, wheat, etc). Bank stocks should benefit from a steeper yield curve, and gold marches to the beat of its own drum, which can be good in a portfolio. I am cautious, however, of other asset classes that have been labeled “alternative.” Real estate, for example, is likely to be negatively influenced by higher rates (just like stocks and bonds), and venture capital/private equity have the same challenges. That is not to say we should not own them, just that the role they play in a portfolio should not be as a diversifier.

I see 2022 as a difficult year for investors. While the back half of the year will probably be better than the first part of the year, I’m not confident we will see the double-digit returns that we have seen for the past few years. For existing clients, I have already been making portfolio adjustments (and will continue to do so). For folks who would like a second opinion on how they are positioned for 2022, we would love to chat with you.

Chart of the Week

Covid has wrought havoc on supply chains, and some price increases are certainly due to that. However, it is very hard to ignore how much the supply of money has increased over the past year. Through 2020, of course, the money supply expanded by 25% year-over-year, which is the largest expansion, by far. However, even if we were to take away that spike, the current money supply expansion would be the largest since 2008 (which was the previous record).

You can think of a dollar as a share of the economy. When the economy is growing each dollar is worth more. When we create more dollars, we subdivide the economy into more pieces, making each dollar worth less. So, there is a tug-of-war: more dollars make each dollar worth a bit less, but a growing economy makes each dollar worth a bit more. Inflation happens when we create dollars faster than the economy grows.

This document is a general communication being provided for informational purposes only. It is educational in nature and not designed to be taken as advice or a recommendation for any specific investment product, strategy, plan feature or other purpose in any jurisdiction, nor is it a commitment from Directional Advisors to participate in any of the transactions mentioned herein. Any examples used are generic, hypothetical and for illustration purposes only. This material does not contain sufficient information to support an investment decision and it should not be relied upon by you in evaluating the merits of investing in any securities or products. In addition, users should make an independent assessment of the legal, regulatory, tax, credit, and accounting implications and determine, together with their own financial professionals, if any investment mentioned herein is believed to be appropriate to their personal goals. Investors should ensure that they obtain all available relevant information before making any investment. Any forecasts, figures, opinions or investment techniques and strategies set out are for information purposes only, based on certain assumptions and current market conditions and are subject to change without prior notice. All information presented herein is considered to be accurate at the time of production, but no warranty of accuracy is given and no liability in respect of any error or omission is accepted. It should be noted that investment involves risks, the value of investments and the income from them may fluctuate in accordance with market conditions and taxation agreements and investors may not get back the full amount invested. Both past performance and yields are not reliable indicators of current and future results.

What I Care About This Week | 2022 Jan 10

by Franklin J. Parker, CFA

The Summary

  • Treasury yields continue to rise, this morning standing above 1.8%—a move of 0.40 percentage points in the space of a few weeks. This has put considerable downward pressure on high-flying tech stocks, and since tech is also a large component of the S&P 500, it has begun to weigh on stocks, generally. With rates moving higher, capital will be more precious, leaving many companies who have been reliant on cheap capital struggling to find additional funding. This is a long-term good, in my view, as it forces companies to deliver value and turn a profit rather than count on investors to continue funding shortfalls. Companies unable to do this will release their resources to companies who can.

  • Employment was the headline news from last week, with the unemployment rate dropping below 4% for the first time since the pandemic began (and the overall figures in the report were quite positive). This is an important milestone and will be likely taken by the Fed as encouragement to act aggressively to curb inflation. The important news for investors, however, was the FOMC minutes that were released. In the minutes it appears that the committee is considering raising rates much faster than previously anticipated. Indeed, the March meeting is now considered “live” for a rate increase. This puts the Fed’s stance as much more hawkish than previously thought.

  • This week, we get inflation data for December, both in the form of the consumer price index (CPI), and the producer price index (PPI). CPI is expected to post around 7% higher year-over-year (slightly higher than November’s reading of 6.8%). PPI is expected to be about 9.8% higher year-over-year (previous was 9.6%). Of course, inflation readings are the core driver of Federal Reserve policy and will be watched very closely.

  • As I have mentioned before, I am cautious with respect to the first half of this year. It has been my view that we could easily see a 15% to 20% pullback in large cap US stocks (likely more in small and growth companies). My view is that this is likely to begin in earnest after earnings season, but now may be an appropriate time to grow more defensive for investors with goals in the near future. For investors with cash to deploy, I would prefer to hold that cash in reserve, to deploy during the pullback. Of course, there is a risk to such a strategy—the correction may not materialize. As I have also said before, I do not see this as the end of the cycle, so for investors with longer-term goals, there is nothing wrong with holding on and riding this one out since the risk of losing upside is greater than the risk of some short-term downside. Of course, this is best discussed with your financial professional. If you don’t have one, please contact us, we’d love to talk with you.

The Details

There has been quite a lot made of the rise of the retail trader, from meme-stocks to cryptocurrencies. I spoke with a friend of mine (and fellow NAAIM award-winner) last week about how retail traders following meme-stocks and random cryptocurrencies have outperformed professionals who are concerned about the risk pervading markets right now.

In many ways, this dichotomy is a symptom of the easy-money policy of the Federal Reserve. Professionals are obsessed with managing and weighing risk (upside risk and downside risk), and for the past several years, Fed policy has pulled downside risk out of markets, leaving professionals behind.

That is, now, beginning to reverse. I see 2022 as a transitional year. For the first part of the year, the Fed will carry an outsized influence, mostly weighing on markets as investors normalize their pricing. Toward the back-half of the year, however, we are likely to return to an environment where economic fundamentals matter again. For me, that is encouraging because economic fundamentals are what drive long-term, sustainable economic growth, and they are indicative of much more traditional kinds of investment risk that I am comfortable managing.

In the end, risk control does matter. As the tide goes out, we may well see who is swimming without a bathing suit.

Chart of the Week

Since mid-October or so, US Treasury yields have been range-bound between 1.35% and 1.70%. Last week, yields on the 10-year broke that critical 1.7% resistance level and have been on a firm move higher. This is putting downward pressure on bonds as well as growth stocks. Analysts estimate that there is still considerable room to run for yields. JPMorgan, for example, expects the 10-year to reach 2.25% by year-end.

As with any market move, there are winners and losers. While growth stocks (and tech in particular) are likely to struggle, bank stocks (especially smaller regional banks) are likely to benefit from higher yields and a steeper yield curve. Investors would do well to note the rotation and accommodate it in their portfolios.

10-Year US Treasury Yield

This document is a general communication being provided for informational purposes only. It is educational in nature and not designed to be taken as advice or a recommendation for any specific investment product, strategy, plan feature or other purpose in any jurisdiction, nor is it a commitment from Directional Advisors to participate in any of the transactions mentioned herein. Any examples used are generic, hypothetical and for illustration purposes only. This material does not contain sufficient information to support an investment decision and it should not be relied upon by you in evaluating the merits of investing in any securities or products. In addition, users should make an independent assessment of the legal, regulatory, tax, credit, and accounting implications and determine, together with their own financial professionals, if any investment mentioned herein is believed to be appropriate to their personal goals. Investors should ensure that they obtain all available relevant information before making any investment. Any forecasts, figures, opinions or investment techniques and strategies set out are for information purposes only, based on certain assumptions and current market conditions and are subject to change without prior notice. All information presented herein is considered to be accurate at the time of production, but no warranty of accuracy is given and no liability in respect of any error or omission is accepted. It should be noted that investment involves risks, the value of investments and the income from them may fluctuate in accordance with market conditions and taxation agreements and investors may not get back the full amount invested. Both past performance and yields are not reliable indicators of current and future results.

What I Care About This Week | 2022 Jan 3

by Franklin J. Paker, CFA

The Summary

  • Rhetoric around the Ukraine/Russia standoff has grown more intense. Biden and Putin held a call last week wherein Biden threatened severe sanctions should Russia invade Ukraine. With winter setting in in Europe, and natural gas supplies from Russia in doubt, there is only so much leverage Washington has to forestall a serious incursion. Furthermore, Ukraine is a bit of a test for the Biden administration. China will watch closely how the strain is handled and met.

  • This week is a busy data week. Tomorrow we get the JOLTS Job Openings report tomorrow, and later in the week we get jobless claims, trade balance, and December’s unemployment report. All of these releases will be watched closely.

  • Just to reiterate the big picture portfolio positioning: coming into late spring/early summer it may make sense to underweight risk assets (stocks, high-yield bonds, etc), and overweight defensive assets, as I expect a significant pullback. As I have said, I do not expect that pullback to be the end of the cycle, so it can be played tactically by nimble investors, or be used as a good entry point for investors with cash. In any case, your goals will govern what is an appropriate move for your portfolio.

The Details

With a new year and many people thinking about their goals and objectives, I thought it sensible to sketch out how investors should think about their investments.

Goals-based investing is all about using markets to achieve your financial goals given real-world constraints. In the goals-based framework, understanding your goals (“your world”) is as important as understanding markets (“the big world”).

We can classify goals by their role in your life. Much like Maslow’s hierarchy, our goals tend to range from foundational needs (things like food and shelter) to dreams (those things we’d like to achieve, but wouldn’t lose sleep over if we don’t).

This framework helps us to understand which types of investments go where. The bottom of the pyramid is where we buy insurance, the top is where we buy lottery tickets, and the middle is where we invest. By understanding what goes where, we can both better organize your financial life and generate better outcomes.

In a goals-based framework, risk is not volatility. Risk, in a goals-based framework, is the probability of failing to achieve your goal. This not only changes our own thinking about how to engage with markets, but also changes the math of asset allocation.

In the end, the goals-based framework aligns the mathematical theory with what it is investors are actually trying to achieve. And, by doing away with some of the absurd assumptions of traditional portfolio theory, we can treat markets as they are, not as we wish they would be. All of this serves to help you achieve your goals more often.

Chart of the Week

The Purchasing Manager’s Index gives us some insight into the health of US manufacturing. Anything over 50 is considered expansionary and anything under 50 is contractionary. As this week’s chart shows, US manufacturing has been in very strong expansion mode, though it has started to wane somewhat in recent months. Still, readings in the high 50s is considered very strong, and that strength is encouraging for continued economic growth.

This document is a general communication being provided for informational purposes only. It is educational in nature and not designed to be taken as advice or a recommendation for any specific investment product, strategy, plan feature or other purpose in any jurisdiction, nor is it a commitment from Directional Advisors to participate in any of the transactions mentioned herein. Any examples used are generic, hypothetical and for illustration purposes only. This material does not contain sufficient information to support an investment decision and it should not be relied upon by you in evaluating the merits of investing in any securities or products. In addition, users should make an independent assessment of the legal, regulatory, tax, credit, and accounting implications and determine, together with their own financial professionals, if any investment mentioned herein is believed to be appropriate to their personal goals. Investors should ensure that they obtain all available relevant information before making any investment. Any forecasts, figures, opinions or investment techniques and strategies set out are for information purposes only, based on certain assumptions and current market conditions and are subject to change without prior notice. All information presented herein is considered to be accurate at the time of production, but no warranty of accuracy is given and no liability in respect of any error or omission is accepted. It should be noted that investment involves risks, the value of investments and the income from them may fluctuate in accordance with market conditions and taxation agreements and investors may not get back the full amount invested. Both past performance and yields are not reliable indicators of current and future results.

What I Care About This Week | 2021 Dec 27

by Franklin J. Parker, CFA

This week’s market update is somewhat abbreviated due to the Christmas and New Year’s holidays.

The Summary

  • Personal consumption expenditures posted the highest year-over-year growth since 1982, coming in at 5.7% in November (see chart below). PCE is an alternate measure of inflation as it reflects what consumers are actually spending at the store, not bound by the specific basket of goods that makes up the consumer price index (official inflation). The Fed looks closely at PCE, as do investors, for a gauge of spending “in the wild.” Such a strong figure puts additional pressure on central banks to reel back the excess cash pushed into the economy over the past couple of years.

  • Equity markets have taken omicron and the threat of central bank tightening in stride, but I am not too surprised by this. Again, my view as been that markets will not start taking rate hikes seriously until February/March of next year. What has surprised me is the complete non-reaction in rate markets. Despite higher inflation, slower purchases from the central bank, and the threat of higher rates next year, US Treasury yields have remained largely unmoved. Admittedly, it is hard for risk-aware capital to push prices given the amount of risk-unaware capital floating around. Still, I do believe that the dam will break sometime, and when yields begin to march higher, investors may do well to be out of the way.

  • Today, the S&P 500 appears poised to log its 69th record close for the year. Yet there is a disconnect: the top 5 stocks in the index have delivered over a third of the return for 2021 (see chart below). After a strong rally early in the year, small caps have traded sideways for most of the rest of the year. And since August, defensive sectors have generally outperformed. The point is, there is an argument to be made that this market is building toward a correction—an argument that is furthered by my read of the macroeconomic fundamentals. Again, my suggestion is to consider growing more defensive with and/or adding some risk controls to portfolios after Q4 earnings season. In the end, your goals will dictate the risks you can afford to take.

Some Charts

Our first chart is that of personal consumption expenditures, and how they have gown year-over-year. November’s spike is a genuine concern as it continues the trend from October. Investors will watch December figures quite closely.

Our next chart is curtesy of Goldman Sachs which shows that over a third of the S&P 500’s 2021 return has come from just five companies: MSFT, AAPL, GOOGL, TSLA, and NVDA. The remaining 495 companies are responsible for the other 65% of returns. It is this divergence that worries some analysts. A more inclusive rally would typically be indicative of a healthier market and economy.

Image

This document is a general communication being provided for informational purposes only. It is educational in nature and not designed to be taken as advice or a recommendation for any specific investment product, strategy, plan feature or other purpose in any jurisdiction, nor is it a commitment from Directional Advisors to participate in any of the transactions mentioned herein. Any examples used are generic, hypothetical and for illustration purposes only. This material does not contain sufficient information to support an investment decision and it should not be relied upon by you in evaluating the merits of investing in any securities or products. In addition, users should make an independent assessment of the legal, regulatory, tax, credit, and accounting implications and determine, together with their own financial professionals, if any investment mentioned herein is believed to be appropriate to their personal goals. Investors should ensure that they obtain all available relevant information before making any investment. Any forecasts, figures, opinions or investment techniques and strategies set out are for information purposes only, based on certain assumptions and current market conditions and are subject to change without prior notice. All information presented herein is considered to be accurate at the time of production, but no warranty of accuracy is given and no liability in respect of any error or omission is accepted. It should be noted that investment involves risks, the value of investments and the income from them may fluctuate in accordance with market conditions and taxation agreements and investors may not get back the full amount invested. Both past performance and yields are not reliable indicators of current and future results.