What I Care About This Week | 2021 March 8

The Summary

  • The roller-coaster ride continued last week as investors digested higher rates, a commitment from the Fed to keep easy money flowing, and no commitment from the Fed to arrest the rise in rates. It is widely believed that there is some level of rates and/or market selloff where the Fed would step in to “stabilize” markets. This means that there is likely some floor to market selloffs so long as the Fed is committed to maintaining their current policy.

  • Wednesday morning we get a read on inflation. The consensus is that inflation sits right around 1.4% (annualized). A print much higher than this expectation would likely send markets reeling. Thursday is initial and continuing jobless claims, which are also important. The expectation is for 4.22 million continuing claims and 725,000 new claims. Again, if the jobs market is improving faster than expected that would likely be bad for markets. Both inflation and employment are central to Federal Reserve policy and since that policy is generally driving markets, major changes in the data could lead to major changes in policy, which is a net negative for financial markets hooked on easy money.

  • I still see the Fed as being very supportive, despite the recent worries to the contrary. Recent market volatility, in my view, is likely to be short-lived and provides a good entry point for investors with cash to deploy. That said, there are some adjustments to portfolios investors should consider given the rise in interest rates. Current clients have already seen those adjustments, and I am, of course, always happy to discuss what those are!

The Details

Market news and commentary has been dominated by the Federal Reserve the past few weeks (I lump inflation in with the Federal Reserve). Since the story of the Fed is largely a story of changes in liquidity, I spent some time over recent months trying to better understand the role of liquidity in market pricing. The high-level results of that analysis were recently published at the CFA Institute’s blog.

In a nutshell, when you add cash to the marketplace, investors will pay a higher price for the exact same investment. Conversely, when you remove that cash from the marketplace, investors pay lower prices. Neither of these pricing effects have anything at all to do with a change in the fundamentals of an investment, they are entirely driven by the relative liquidity of investors operating in the market.

While this may seem obvious, it is not the traditional view of markets.

I have been mildly surprised by the reaction of various money managers to the actions of the Federal Reserve. Traditional value investors have been frustrated at the absurd expansion in stock valuations. Growth-oriented investors—the main beneficiaries of Fed policy—have taken a few victory laps, while macro-oriented investors, like Ray Dalio’s Bridgewater Associates, realized quickly that their fortunes are intimately tied to Fed policy. Last year, in fact, Dalio quickly called on the Fed to “go big” in their efforts to salvage the Covid-striken economy. Coincidentally, his fund was down 20% at the time (and has recovered in the wake of the Fed’s actions).

The point is, liquidity matters differently to different investment styles. For growth-oriented investors, the massive expansion in liquidity has been a tailwind driving increased valuations. Value-oriented investors, however, have experienced a marketplace that does not reward well-run companies nor punish poorly-run companies. Recent liquidity flows have created winners and losers.

But things change often in markets. As Bob Dylan said, “for the loser now will be later to win… for the times they are a changin’.” In times like today, mental flexibility and an ability to adjust quickly can be the difference between achieving your goals or not.

Chart of the Week

We have some historical examples of how markets react during rising rates. In 2013, we had the “taper tantrum” wherein the 10-year US Treasury moved upward 1.35 percentage points in the space of about four months. In this week’s chart, we look at how this move affected markets, and how the current year compares.

In May 2013, the 10-year US Treasury began to move slowly upward (bottom panel in the top chart below). Note that it took almost a month before markets began to readjust. From its peak in mid-May, the S&P 500 (top panel in chart below) fell about 6% over the course of a month. It rebounded strongly, rallying 8% in July, only to fall another 4.5% into September. As the 10-year US Treasury stabilized, markets recovered strongly, rallying 6% through September 2013. After another quick downswing, the S&P moved steadily higher afterward.

This is all eerily similar to recent market moves (bottom chart). Since January 2021, the 10-year US Treasury yield has moved from about 1.0% to 1.6%, and is expected to continue its climb. As in 2013, it took a solid month for markets to realize this move was here to stay. Similar to 2013, there have been moves down and back up.

Of course, the moves in 2013 took 4-6 months, and we are only about 3 months into the current move. As in 2013, I would expect to see continued volatility in stocks, but with a general trend upward. And while history doesn’t repeat itself exactly, it does tend to rhyme—It looks like 2021 is going to rhyme with 2013.

2013: the S&P 500 (top panel) and the 10-year US Treasury Yield (bottom panel)
2021: The S&P 500 (top panel) and the 10-year US Treasury yield (bottom panel).

This document is a general communication being provided for informational purposes only. It is educational in nature and not designed to be taken as advice or a recommendation for any specific investment product, strategy, plan feature or other purpose in any jurisdiction, nor is it a commitment from Directional Advisors to participate in any of the transactions mentioned herein. Any examples used are generic, hypothetical and for illustration purposes only. This material does not contain sufficient information to support an investment decision and it should not be relied upon by you in evaluating the merits of investing in any securities or products. In addition, users should make an independent assessment of the legal, regulatory, tax, credit, and accounting implications and determine, together with their own financial professionals, if any investment mentioned herein is believed to be appropriate to their personal goals. Investors should ensure that they obtain all available relevant information before making any investment. Any forecasts, figures, opinions or investment techniques and strategies set out are for information purposes only, based on certain assumptions and current market conditions and are subject to change without prior notice. All information presented herein is considered to be accurate at the time of production, but no warranty of accuracy is given and no liability in respect of any error or omission is accepted. It should be noted that investment involves risks, the value of investments and the income from them may fluctuate in accordance with market conditions and taxation agreements and investors may not get back the full amount invested. Both past performance and yields are not reliable indicators of current and future results.

What I Care About This Week | 2021 Mar 1

by Franklin J. Parker, CFA

The Summary

  • Worries about inflation spread through risk markets last week despite assurances from the Federal Reserve that they plan to continue current policy for the foreseeable future. Bond investors were particularly unconvinced and the benchmark yield on the 10-year US Treasury spiked to 1.50% (meaning bond prices fell, generally).

  • This week sees speeches from several Fed governors, as well as important data drops. We get a read on the health of manufacturing as well as non-manufacturing sectors from the Institute for Supply Management’s various indices.
    • Manufacturing PMI posted this morning at a whopping 60.8—beating the expected 58.8! Anything over 50 is expansion, and 60 is about as good as that index ever gets.
    • Headline unemployment data also posts on Friday and the expectation is a headline unemployment rate of 6.3%. Ironically, a post much less than that may be bad for risk assets (like stocks) as it could perceived as a trigger to slow easy-money policy.

  • Last week’s market movements showed just how dependent all investments are on Federal Reserve policy. The traditional idea that bonds offset losses in stocks (and vice versa) has been broken as all asset classes have traded in tandem with the same cause: the Federal Reserve. In short, diversification is not working when we need it to. Finding alternative ways to mitigate risk in our portfolios, therefore, has become a chief concern.

The Details

I remember in 2008 how I began to question whether the traditional advice still worked. Diversification, specifically, was on my mind because it didn’t work very well. I remember in October of 2008, stocks, bonds, and gold were all down. Even worse, after the failure of Lehman Brothers, money market accounts were in danger of not returning dollar-for-dollar. The FDIC stepped in and temporarily guaranteed money market funds against loss just to calm the panic. In short, not even cash was safe in October of 2008.

Our current environment is not as dramatic as all that, but it poses similar challenges. Markets have shown us over the past year that diversification is not working like it should. In moments of stress, stocks, bonds, and even gold, tend to sell off in tandem! Yet, when markets rally again, they tend to not move up together. This gives us the worst of diversification with none of the benefits.

I am not advocating for the abandonment of diversification. However, I am beginning to use some other risk mitigation techniques within our portfolios. There are pockets of the bond market, for example, which do not trade so directly with the Federal Reserve, and cash is a nice hedge against stressful moments. Of course, I cannot be too specific because different individuals will require different techniques, but suffice it to say that we may be entering a period where tradecraft can play a greater role in portfolio management.

Chart of the Week

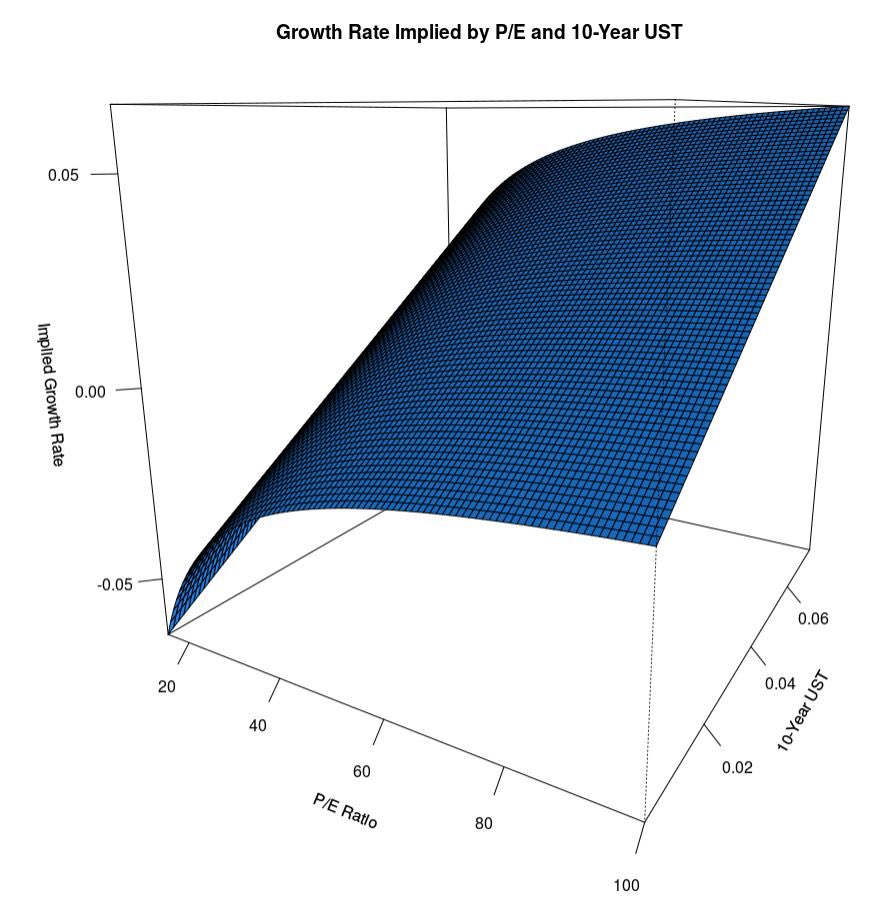
The big news last week was, of course, the move in 10-year US Treasury yields. They reached their highest rate in about a year. This week’s chart places recent yield changes in a broader context. Clearly, the past 12-months have been the aberration in yields, not the norm—a more “normal” yield for the 10-year US Treasury is in the 2% range (though even that is low by historical standards).

Recent moves can really be seen as a return to more normal times.

That said, there is a rather wonky technical effect also at play. Stocks are priced as the sum of discounted future earnings. Most analysts use the 10-year US Treasury as a discount rate. So, as this rate rises, stock prices should fall all else being equal. The second plot illustrates this. For the P/E ratio on the S&P 500 to remain the same when yields rise, economic growth expectations must rise, as well. Conversely, if rates rise and growth expectations do not, then the P/E ratio will fall (and so will price).

There are many forces at work, of course, so we cannot make too much of this. Even so, it is a legitimate effect that must be considered in our investment portfolios.

This document is a general communication being provided for informational purposes only. It is educational in nature and not designed to be taken as advice or a recommendation for any specific investment product, strategy, plan feature or other purpose in any jurisdiction, nor is it a commitment from Directional Advisors to participate in any of the transactions mentioned herein. Any examples used are generic, hypothetical and for illustration purposes only. This material does not contain sufficient information to support an investment decision and it should not be relied upon by you in evaluating the merits of investing in any securities or products. In addition, users should make an independent assessment of the legal, regulatory, tax, credit, and accounting implications and determine, together with their own financial professionals, if any investment mentioned herein is believed to be appropriate to their personal goals. Investors should ensure that they obtain all available relevant information before making any investment. Any forecasts, figures, opinions or investment techniques and strategies set out are for information purposes only, based on certain assumptions and current market conditions and are subject to change without prior notice. All information presented herein is considered to be accurate at the time of production, but no warranty of accuracy is given and no liability in respect of any error or omission is accepted. It should be noted that investment involves risks, the value of investments and the income from them may fluctuate in accordance with market conditions and taxation agreements and investors may not get back the full amount invested. Both past performance and yields are not reliable indicators of current and future results.

What I Care About This Week | 2021 Feb 22

by Franklin J. Parker, CFA

The Summary

  • Suddenly everyone cares about inflation. Bond and stock investors are adjusting portfolios in an attempt to get ahead of a possible inflation spike. This is pushing bond yields higher (and prices down) and generally pushing stocks down, though some sectors are holding up fairly well.

  • The $1.9 trillion stimulus package is entering its final stretch. The House is expected to vote on the provision at the end of this week, and negotiations in the Senate are in full swing–all 50 Democrat senators are needed to pass the measure. Markets have priced-in the direct stimulus provisions, such as the $422 billion in direct payments to individuals and $250 billion in extended unemployment benefits. Signs of wavering would likely send stock prices lower.

  • This is a busy week on the economic data front: we get talks from two Fed governors (who will no doubt address the inflation concern), Fed chairman Powell testifies on Wednesday, durable goods orders post on Thursday along with initial jobless claims, and Friday sees data on personal incomes/spending and consumer sentiment. I would expect some volatility, especially on Wednesday, as investors digest this information.

The Details

Inflation is dominating the news (seriously, inflation is pretty much the only story across my news feed). It is interesting to me how a known problem can come to dominate market consciousness all at once. There is nothing all that different about today’s economic environment versus six months ago, but all of a sudden investors across stocks, bonds, and commodities, are moving portfolios around in an attempt to get ahead of a possible spike in inflation. To be fair, US Congress is about to authorize $1.9 trillion in spending that is to be financed largely by the Federal Reserve (read as: newly created money).

That said–and I admit this is difficult for me to say–I’m not sure inflation is as big a concern as everyone is making it out to be right now. Of course, I am taking steps to inoculate portfolios from inflation risk, but there are three basic reasons why I see the sudden excessive worry as misplaced.

First, the Federal Reserve has a unique way of measuring inflation: they tend to factor out energy and food prices (because they are volatile) and they look more closely at prices on consumer goods. While we have begun to see some price inflation in consumer goods, much of that is simply due to Covid-related supply shortages (which can be fixed relatively quickly), not necessarily from a structural shift. The Fed has repeatedly made this point, so I would not expect a policy shift from them even if inflation spiked for a few months.

Second, the Fed changed their policy on inflation management. Previously, the Fed would take action if inflation posted higher than 2%. Now, however, the Fed intends to “average” inflation over “a cycle.” The vague language is almost certainly intentional. The current inflation management policy gives the Fed plenty of room to let inflation run hotter than normal before taking action. On the downside, the lack of a clear line also makes reading their next move that much harder.

The third reason brings us to the Chart of the Week…

Chart of the Week

It is my view that inflation won’t be a problem until interest rates rise meaningfully, which hasn’t happened yet. There is some nuance to this view, but in the end it has to do with opportunity cost. All of this newly-created money is getting “stuck” in financial markets, banks, and corporations because there is no difference between holding cash and investing it. Because people are hoarding that cash it isn’t causing inflation.

When interest rates rise, however, suddenly there is a cost to holding cash. People begin to invest their cash as do corporations. At that point, cash begins to move around the economy and that is when inflation shows up. As you can see in this week’s chart, even though the money supply has expanded at the fastest pace on record, the velocity of money (a measure of how often a dollar changes hands) has simultaneously plummeted in 2020.

This document is a general communication being provided for informational purposes only. It is educational in nature and not designed to be taken as advice or a recommendation for any specific investment product, strategy, plan feature or other purpose in any jurisdiction, nor is it a commitment from Directional Advisors to participate in any of the transactions mentioned herein. Any examples used are generic, hypothetical and for illustration purposes only. This material does not contain sufficient information to support an investment decision and it should not be relied upon by you in evaluating the merits of investing in any securities or products. In addition, users should make an independent assessment of the legal, regulatory, tax, credit, and accounting implications and determine, together with their own financial professionals, if any investment mentioned herein is believed to be appropriate to their personal goals. Investors should ensure that they obtain all available relevant information before making any investment. Any forecasts, figures, opinions or investment techniques and strategies set out are for information purposes only, based on certain assumptions and current market conditions and are subject to change without prior notice. All information presented herein is considered to be accurate at the time of production, but no warranty of accuracy is given and no liability in respect of any error or omission is accepted. It should be noted that investment involves risks, the value of investments and the income from them may fluctuate in accordance with market conditions and taxation agreements and investors may not get back the full amount invested. Both past performance and yields are not reliable indicators of current and future results.

Achieving Goals While Making an Impact

Impact investing has grown considerably over the past several years. According to the Global Impact Investing Network, the total size of the impact investing market has grown by about 14% per year since 2015. It is clear that many investors are interested in allocating at least some of their wealth toward investments which bring about social good as well as a financial return on investment.

But when you have financial goals to achieve, how much return should you give up to pursue an impact investing mandate?

This was the subject of Franklin Parker’s recent paper published in the Journal of Impact and ESG Investing. Striking the right balance between achieving financial outcomes and achieving social outcomes is not as straightforward as one might expect, and investors of all types would do well to follow a basic framework for balancing these tradeoffs.

Understand Your Goals

The first step is to understand and articulate your objectives. Is achieving the financial or social goal more important? If social outcomes are the most important objective, it is likely that philanthropy is a better use for some or all of the funds. Parker shows that when you value the social outcome more than your financial goal, you are willing to accept a complete loss on your investment–effectively making you a philanthropist rather than an impact investor.

That is not to say that outright giving is bad! Rather, we need to understand how to direct your capital to best accomplish your objective–whether that be philanthropy, impact investing, or something else entirely.

How Important is the Impact Mandate to You?

When the financial goal is more important than the social outcome (but you’d still like to have both), the conversation should progress to an understanding of your willingness to give up one goal for the other. Put simply: how much probability of achieving your financial goal are you willing to give up to incorporate the impact mandate? Are you willing to move from a 90% chance of attaining your financial goal to an 85% chance? What about moving from a 90% chance to a 60% chance?

The answer to these questions will help your advisor understand how much you value the impact mandate relative to your financial goal, and it becomes a simple matter to calculate the maximum return drag you are willing to accept. In the end, this yields impact investment plans that you can stick with for the long haul.

Things Change, So Do People

Another interesting conclusion of this research is that your willingness to sacrifice return is not constant through time. There are times when you are more willing and less willing to sacrifice return for an impact mandate. You tend to be more willing to sacrifice returns for an impact mandate in the face of highly volatile markets, for example.

The importance of the financial goal matters too. You tend to be less willing to incorporate an impact mandate for more important financial goals. This could be a source of contention for wealth intended to support multiple generations. The older generation, for example, could feel that the family’s current wealth as more than enough to support their own needs, giving them more psychological freedom to sacrifice returns. The younger generation may not feel quite so confident.

Location, Location, Location

Account types matter, too! Whereas personal accounts are generally most appropriate for impact investing mandates, many trusts, charities, foundations, pensions, and retirement plans may wish to pursue such mandates, as well. Despite this desire, impact investing cannot be pursued with equal vigor across every account type! There are various legal nuances for assets, based on their location, and these govern how or whether you can pursue an impact investment mandate.

Knowledgeable Help

In the end, an advisor who understands your goals–both ethical and financial–is key to helping you implement an effective and efficient impact investment program. At Directional, we are eager to help you navigate these waters.

What I Care About This Week | 2021 Feb 15

by Franklin J. Parker, CFA

The Summary

  • Investors will be closely watching the progress of the latest stimulus package. The current proposal is worth around $1.9 trillion. Though Congress is out this week, the package has cleared initial negotiations and appears to be on track to pass via the reconciliation method, which only requires a simple majority. The bill is expected to be assembled by the House Budget Committee this week, with passage in the House expected next week. Markets are likely to trade on news, pricing the likelihood and timing of passage.

  • Wednesday has a couple of important data drops: the Fed minutes, and the producer price index. The Fed minutes will be parsed by market participants looking for clues to when/if policy normalization is to begin. Producer price indexes are usually viewed as an early indicator of inflation, though some of that link has been weaker lately. Either of these could move markets.

  • Earnings have been generally good (with about 75% of companies having reported): more companies are beating their estimates than average, and they are beating these estimates by a larger margin than average. No big surprise, tech and financials have posted the largest percentage of “beats” across sectors, while energy and real estate have posted the fewest percentage of “beats”. Still, 67% of energy companies have beaten earnings expectations, which is still quite good. Interested folks can read more at FactSet.

The Details

As we’ve discussed before, extreme market valuations are being supported by the central banks. Low interest rates and continued expansion of the money supply (printing money) serve to keep financial markets up. The latest round of stimulus proposals, then, are an important component of this continued market rally, and investors are likely to push prices around in response to any news surrounding it.

To fund stimulus, Congress authorizes the US Treasury to borrow money. In the past, it was investors (both domestic and international) who lent that money to the United States. In recent years, however, a significant percentage of that money is lent by the Federal Reserve. The Fed creates the money and then lends it to the US Treasury. In this scenario inflation becomes the major constraint on spending–higher inflation limits the Fed’s ability to print money, which limits the Treasury’s ability to borrow, and ultimately hinders Congress’ ability to spend. In the end, this pushes investors to watch inflation data very closely.

This is why markets are heavily influenced by central bank commentary (hence the importance of Fed minutes scheduled to post on Wednesday) and inflation data. Hints of the Fed pulling back spending would lead investors to push down stock valuations.

On the upside, earnings are posting generally better than expected. Most companies in the S&P 500 have posted results, and most of those are better than anticipated. Even energy, the laggard over the past year, has seen 2/3rds of companies post earnings which are better than expected.

It is my view that markets will continue to be bolstered in the coming months by the Fed and Congressional stimulus. There are certainly risks facing investors, and ultimately your goals and objectives will determine your course, but I see more upside than downside risk in the coming months. In my view (which can change in a moment, by the way), investors can use market dips as entry points.

Chart of the Week

As frigid temperatures grip the Southern US this week (parts of Texas are colder than Alaska!), energy markets have been sent on a wild ride! This week’s chart comes from Bloomberg, and it shows the spot cost per megawatt-hour of Texas electricity–a 3400% jump within a few hours. Oil and natural gas prices are also getting a boost from the sudden cold snap.

This document is a general communication being provided for informational purposes only. It is educational in nature and not designed to be taken as advice or a recommendation for any specific investment product, strategy, plan feature or other purpose in any jurisdiction, nor is it a commitment from Directional Advisors to participate in any of the transactions mentioned herein. Any examples used are generic, hypothetical and for illustration purposes only. This material does not contain sufficient information to support an investment decision and it should not be relied upon by you in evaluating the merits of investing in any securities or products. In addition, users should make an independent assessment of the legal, regulatory, tax, credit, and accounting implications and determine, together with their own financial professionals, if any investment mentioned herein is believed to be appropriate to their personal goals. Investors should ensure that they obtain all available relevant information before making any investment. Any forecasts, figures, opinions or investment techniques and strategies set out are for information purposes only, based on certain assumptions and current market conditions and are subject to change without prior notice. All information presented herein is considered to be accurate at the time of production, but no warranty of accuracy is given and no liability in respect of any error or omission is accepted. It should be noted that investment involves risks, the value of investments and the income from them may fluctuate in accordance with market conditions and taxation agreements and investors may not get back the full amount invested. Both past performance and yields are not reliable indicators of current and future results.

What I Care About This Week | 2021 Feb 8

by Franklin J. Parker, CFA

The Summary

  • Jobs data last week showed considerable weakness in the labor market through January. While this would normally be bad news, poor data provides cover for the Federal Reserve to continue printing money (called Quantitative Easing or QE) and Congress to send cash directly to households. Both of these are very positive for market prices in the short term, and investors will continue to watch Washington for signals that further stimulus is still on track.

  • This week we get a large percentage of the S&P 500 reporting earnings, including consumer brands like Coca-Cola, Pepsi, and Walt Disney. Investors will watch these calls very closely. Big tech posted absolutely stellar earnings last week. AMZN was the superstar, but market reaction was muted with Bezos’ announcement that he is stepping down as CEO. GOOGL posted earnings 45% above this time last year (which was pre-pandemic)!

  • Inflation data posts on Wednesday. Inflation has become a much more important data point that usual because it is the only real constraint on central bank activity. If inflation begins to surge, investors will expect the Federal Reserve to reign in QE, which would force investors to re-evaluate lofty stock valuations. In short: hotter inflation leads to a stock and bond market selloff, in our view.

The Details

Though it has been improving, no matter how you slice it the fundamental economic data is pretty bad. There are several data points which are at their worst levels since records have been kept. For example,

  • Weekly initial jobless claims,
  • The headline unemployment rate, and
  • The year-over-year contraction in consumer spending,

are all at levels never-before seen. You couldn’t guess that by looking at stock and bond markets, though! The level of divergence between stocks and the real economy is staggering. It only makes sense when we consider the role of newly-printed cash flooding into the economy. Most of that cash finds its way into financial markets sooner or later, and it serves to push prices higher. My own research shows that, all else equal, giving investors more cash makes them perfectly willing to pay a higher price for the exact same security.

So, while I am indeed concerned about valuations (stocks have only been more expensive twice in history: 1929 and the late 1990s), these valuations are sustainable so long as the Federal Reserve keeps doing what it is doing. When current policy ends, it seems likely to me that current valuations will become unsustainable and a market dip becomes considerably more likely. Our portfolio positioning will be heavily influenced by our outlook on Fed policy.

Chart of the Week

With all the talk of Federal Reserve policy and its effects on asset prices, I thought it prudent to also discuss consequences of this policy. Inflation is, of course, the primary concern (and my nuanced thoughts on inflation deserve an entire post). More pressing, however, is the rise of “zombie” companies. In a nutshell, zombie companies are firms which have existed for five or more years and do not make enough revenue to cover the cost of their debt. This means they are forced to constantly seek new capital from investors to continue operating.

The Bank of International Settlements has now published several papers on this topic, the most recent of which I feature in this week’s chart of the week. Banerjee and Hofmann document the rise of zombie companies in various economies which they directly attribute to central bank policy of low interest rates and easy money. They have found that the share of zombie companies in the global economy has grown from around 4% in the early 1990s to around 16% as of 2017. They also find (unsurprisingly) that zombie companies invest less in physical capital (factories, equipment, etc), are less productive, and are considerably more leveraged than their non-zombie counterparts. In addition, their performance deteriorates significantly as they age.

In the end, an economy full of zombie companies lowers productivity, wage growth, and economic dynamism. That is, of course, not preferable to a dynamic and productive economy. In the end, this may be the most significant immediate side-effect of central bank policy.

This document is a general communication being provided for informational purposes only. It is educational in nature and not designed to be taken as advice or a recommendation for any specific investment product, strategy, plan feature or other purpose in any jurisdiction, nor is it a commitment from Directional Advisors to participate in any of the transactions mentioned herein. Any examples used are generic, hypothetical and for illustration purposes only. This material does not contain sufficient information to support an investment decision and it should not be relied upon by you in evaluating the merits of investing in any securities or products. In addition, users should make an independent assessment of the legal, regulatory, tax, credit, and accounting implications and determine, together with their own financial professionals, if any investment mentioned herein is believed to be appropriate to their personal goals. Investors should ensure that they obtain all available relevant information before making any investment. Any forecasts, figures, opinions or investment techniques and strategies set out are for information purposes only, based on certain assumptions and current market conditions and are subject to change without prior notice. All information presented herein is considered to be accurate at the time of production, but no warranty of accuracy is given and no liability in respect of any error or omission is accepted. It should be noted that investment involves risks, the value of investments and the income from them may fluctuate in accordance with market conditions and taxation agreements and investors may not get back the full amount invested. Both past performance and yields are not reliable indicators of current and future results.

Let’s Talk About Risk

by Franklin J. Parker, CFA

When most people think about risk in an investment context, they think of one thing: losing money. What most of us never stop to think about is why. Why are we afraid of losing money?

I’ll admit, at first glance this seems like a dumb question. No one likes to lose money, so that must be risk. But by digging deeper we can reveal the true nature of risk. If we can understand what risk really is, then we can both manage it and our own psychology better.

No one invests for the fun of it. We invest with some end in mind. We invest in order to accomplish our longer-term financial goals. Risk, then, is different from market ups-and-downs (which is the classic academic definition), and it is different from just “losing money.” Risk, at heart, is the probability that you do not achieve your goals. It is not that losing money is uncomfortable in and of itself. Rather, we don’t like losing money because it means we are less likely to achieve our goals!

This is a fundamental realization of goals-based investing, and it leads to a few differences in how we at Directional Advisors approach money management.

First, it means that we can quantify downside risk in your investment portfolio. What market losses would derail your goals? When are investment losses too much? Rather than guess at the answers to these questions, we can calculate them. By calculating them, we can take steps to mitigate the risk of unrecoverable losses in your investment portfolio.

This also leads to better management of our own psychology. We are afraid of investment losses because we don’t know if we can recover in time to achieve our goals. That is why all investment losses feel like too much. By quantifying downside risk, we can better understand when it is appropriate to worry and when market downswings are within our tolerance. Furthermore, by taking steps to mitigate the risks of excessive investment losses we can even further decrease the amount of worry. While there are no guarantees in life, this can go a long way to easing our stress about investing.

Second, this fundamentally changes how we organize our investments. Portfolios are put together in a way that maximizes the chances of hitting your goal. While your risk tolerance should be part of the conversation, it should not be the primary metric for managing your portfolio. Imagine going to the doctor and getting a battery of tests. Your doctor explains the problem but informs you that she cannot proceed with the necessary treatment because the pain-tolerance questionnaire you filled out at intake indicates that you are too conservative to proceed! While your comfort with market volatility is a part of the conversation, it should not be the only deciding factor in your investment portfolio.

Third, goals-based investors can recognize that markets are not tame. There are moments when markets can erase years of saving and sacrifice. We need to recognize that risk up front and take steps to mitigate it in your portfolio. We believe there are times to be cautious and times to be more aggressive. What to do when is determined by our outlook for markets, and also the specifics of your goals.

In the end, investment risk is perceived and managed through the lens of our goals. By better understanding what risk is, we can better understand how it should be managed.

This document is a general communication being provided for informational purposes only. It is educational in nature and not designed to be taken as advice or a recommendation for any specific investment product, strategy, plan feature or other purpose in any jurisdiction, nor is it a commitment from Directional Advisors to participate in any of the transactions mentioned herein. Any examples used are generic, hypothetical and for illustration purposes only. This material does not contain sufficient information to support an investment decision and it should not be relied upon by you in evaluating the merits of investing in any securities or products. In addition, users should make an independent assessment of the legal, regulatory, tax, credit, and accounting implications and determine, together with their own financial professionals, if any investment mentioned herein is believed to be appropriate to their personal goals. Investors should ensure that they obtain all available relevant information before making any investment. Any forecasts, figures, opinions or investment techniques and strategies set out are for information purposes only, based on certain assumptions and current market conditions and are subject to change without prior notice. All information presented herein is considered to be accurate at the time of production, but no warranty of accuracy is given and no liability in respect of any error or omission is accepted. It should be noted that investment involves risks, the value of investments and the income from them may fluctuate in accordance with market conditions and taxation agreements and investors may not get back the full amount invested. Both past performance and yields are not reliable indicators of current and future results.

What I Care About This Week | 2021 Feb 1

Franklin J. Parker, CFA
chief investment officer

The Summary

  • The Volatility of last week is likely to continue into this week as investors watch for the risk that large fund failures lead to a systemic problem.
  • We get a read on the various sectors of the economy in the first half of the week, and a read on the health of the labor market in the back half.
  • Though recent volatility may be unnerving, we believe the Federal Reserve remains committed to supporting markets. In our view, the Fed and the promise of further stimulus from Congress keeps an upward bias in prices for the time being. We see the recent downswing in stocks as an entry point for patient investors.

The Details

Last week’s big news was a classic David vs Goliath story: an army of retail traders took on big Wall Street hedge funds… and won! Their weapon was GameStop (GME), a brick-and-mortar video game retailer which has been in decline for some time. Hoping to profit on the decline, many hedge funds had sold the stock short. Coordinated through social media, retail traders began furiously buying the stock, pushing the price higher and triggering what is known as a “short squeeze.” In an effort to limit losses and make good on their commitments to return the shares of GME, the hedge funds had to quickly buy the stock back, driving the price of GME still higher and triggering still more short-sellers to buy.

The price of GME was pushed so high that many of these funds, which use quite a lot of borrowed money to leverage their returns, were in danger of bankruptcy. Because bankrupt firms cannot make good on their obligations, investors have begun to worry about the ability of these funds to make good on their commitments to others in the marketplace. It was this danger of systemic risk that pushed brokerages such as RobinHood, E-Trade, Interactive Brokers, and TD Ameritrade to curtail trading in not just GME, but other stocks as well.

I see the market volatility that ended last week as likely driven by investors repricing this systemic risk, and an effort by levered funds to raise cash quickly by selling their higher-quality investments. While this volatility may continue in the near term, and while there are systemic risks in play, it is my view that this downswing will be short lived. Liquidity concerns are likely to be met with Federal Reserve policy, and stimulus payments tend to bolster prices as well. Investors can use this moment as an entry point for cash, or simply wait it out. Of course, as the situation develops, this advice may develop along with it!

Chart of the Week

I have been surprised by the very rapid recovery in US manufacturing. Interestingly, however, the decline in manufacturing was no worse than it traditionally has been in a recession. In fact, 2008 saw a more significant decline in manufacturing, and that was a recession caused by a credit crunch! The recovery has been among the quickest, however, and though a only small piece of the US economy, manufacturing tends to precede other recoveries in other sectors. This bodes well for the fundamental economic outlook.


This document is a general communication being provided for informational purposes only. It is educational in nature and not designed to be taken as advice or a recommendation for any specific investment product, strategy, plan feature or other purpose in any jurisdiction, nor is it a commitment from Directional Advisors to participate in any of the transactions mentioned herein. Any examples used are generic, hypothetical and for illustration purposes only. This material does not contain sufficient information to support an investment decision and it should not be relied upon by you in evaluating the merits of investing in any securities or products. In addition, users should make an independent assessment of the legal, regulatory, tax, credit, and accounting implications and determine, together with their own financial professionals, if any investment mentioned herein is believed to be appropriate to their personal goals. Investors should ensure that they obtain all available relevant information before making any investment. Any forecasts, figures, opinions or investment techniques and strategies set out are for information purposes only, based on certain assumptions and current market conditions and are subject to change without prior notice. All information presented herein is considered to be accurate at the time of production, but no warranty of accuracy is given and no liability in respect of any error or omission is accepted. It should be noted that investment involves risks, the value of investments and the income from them may fluctuate in accordance with market conditions and taxation agreements and investors may not get back the full amount invested. Both past performance and yields are not reliable indicators of current and future results.

Exit mobile version
%%footer%%