What I Care About This Week | 2022 July 11

by Franklin J. Parker, CFA

The Summary

  • LOTS of important data this week. For starters, earnings begin this week with the big banks. Investors will watch closely for guidance from bank CEOs on the expectation for loan losses as they are an important indication of the economic outlook. Inflation data posts Wednesday (8.8% expected), obviously this is an important data point (more on that in this week’s details). Thursday we get producer prices, another inflation indicator. Friday is retail sales and consumer sentiment. All of these data points could move markets.

  • A not-widely-talked-about item of concern is the ongoing negotiations between the union representing dockworkers at US ports (ILWU), and the cargo companies and terminal operators. The ILWU’s contract expired on July 1, and though talks are still ongoing, there is worry among industry analysts that a strike or walkout could occur if negotiations turn sour. That would put some 40% of all inbound US cargo at risk. With supply chains already stressed, this is an event for which investors should prepare their portfolios.

The Details

Inflation continues to be a hot topic, and it is dividing analysts.

While headline inflation continues to tick higher—this month’s is expected at 8.8% while last month’s was 8.6%—core inflation (inflation minus volatile food and energy) has been falling. Some analysts say “so what?”, food and energy represent a significant portion of household spending, so to the extent that inflation affects consumers it is having its effect.

Other analysts point to falling core inflation as a signal that supply chain woes and other expenses are beginning to normalize and, once the war in Ukraine subsides (or is better absorbed), falling food and energy costs will pull down headline inflation, too.

In my view, inflation has three affects that investors should be concerned with. (1) The role inflation has in the Fed’s policy adjustments, (2) the role inflation has in absorbing spending that would otherwise drive economic growth, and (3) its negative affect on consumer sentiment (when people feel poorer, they tend to spend less).

The Fed appears to be committed to bringing down headline inflation, so interpreting those figures through that lens is important for investors, and it does appear that consumers have had to curtail other spending in order to absorb higher food and energy costs. They also appear to be taking on more debt to compensate (which cannot go on forever). And consumer sentiment is hitting pretty extreme lows.

All of that said, it does not appear that consumers have curtailed their spending in a significant way just yet. Although, retail sales (on Friday) along with retail earnings will give us better insight into all of that. Signals that the consumer is struggling would up my timeline for a recession considerably. Slack demand is the typical cause of recessions, and up to now demand has been robust. If that is changing, the economy will likely start to sputter.

Chart of the Week

Since we are on the topic, this week’s chart shows the relationship between inflation and personal incomes. As the chart demonstrates, other than a couple of blips, 2022 has been the first year in a decade that households have seen their real incomes fall due to inflation. Most of the past decade has seen personal incomes increase more than inflation. So, event though personal incomes have risen higher than average over the past year, inflation has risen even more.

This document is a general communication being provided for informational purposes only. It is educational in nature and not designed to be taken as advice or a recommendation for any specific investment product, strategy, plan feature or other purpose in any jurisdiction, nor is it a commitment from Directional Advisors to participate in any of the transactions mentioned herein. Any examples used are generic, hypothetical and for illustration purposes only. This material does not contain sufficient information to support an investment decision and it should not be relied upon by you in evaluating the merits of investing in any securities or products. In addition, users should make an independent assessment of the legal, regulatory, tax, credit, and accounting implications and determine, together with their own financial professionals, if any investment mentioned herein is believed to be appropriate to their personal goals. Investors should ensure that they obtain all available relevant information before making any investment. Any forecasts, figures, opinions or investment techniques and strategies set out are for information purposes only, based on certain assumptions and current market conditions and are subject to change without prior notice. All information presented herein is considered to be accurate at the time of production, but no warranty of accuracy is given and no liability in respect of any error or omission is accepted. It should be noted that investment involves risks, the value of investments and the income from them may fluctuate in accordance with market conditions and taxation agreements and investors may not get back the full amount invested. Both past performance and yields are not reliable indicators of current and future results.

What I Care About This Week | 2022 July 5

by Franklin J. Parker, CFA

The Summary

  • It is jobs week! We got factory orders today, which surprised to the upside (1.6% growth vs 0.5% expected). JOLTS job openings report tomorrow, we get the unemployment rate and average earnings on Friday. Employment is the key figure in ongoing economic growth, so it could move markets.

  • Last week’s data was a mixed bag: consumers spent more than they earned for the first time since December. In addition, personal consumption expenditures increased at an uncomfortably higher level, though if we factor out food and energy costs, it does appear that PCEs are slowing, although it may also be that consumers are having to stop buying other things to keep up with rising food and energy costs. PCEs are the Fed’s preferred measure of inflation, so higher figures here drew pessimism from market participants about the outlook for Fed policy.

  • Next week kicks off earnings season. Maybe more than anytime before, this earnings season will be critical. Because this economic environment is so ambiguous (if we are in a recession, for example, it is the strangest recession on record), investors will be watching corporate results and their outlook for direction. At the end of the day, earnings growth is what drives market prices. If earnings growth is expected to wane, prices are likely to fall further. Despite the doom and gloom, this quarter is expected to see positive earnings growth for the market as a whole.

The Details

There is a controversy silently brewing between the investment management industry and regulators. “Greenwashing” has become a real, and not often talked about, problem.

With ESG investing (Environmental, social, and governance investing) becoming more popular, regulators have begun to take notice of funds and investment managers that make claims to the investing style, but do not back up their actions with the claims. “Greenwashing” is the term that describes an investment strategy that claims to have an ESG mandate, but whose holdings are indistinguishable from a non-ESG mandate. It can also refer to an investment process that has a marketing banner of ESG, but does not, in fact, consider any ESG factors in the security selection process.

The challenge, of course, is that there is no standard definition for ESG investing. Because ESG investing is very personal, I doubt a standard definition ever could exist. For example, one investor might include Tesla in an ESG strategy because of its positive environmental impact, while another might exclude Tesla because of its poor social or governance components. The point is: every investor values each ESG component separately, belying any attempt to codify the practice across the industry.

Recently, regulators in Germany outright raided Deutsche Bank’s asset management unit on allegations of greenwashing. The SEC recently proposed two new rules to combat it.

More than anything, securities regulators do not like lying. If a firm says they are running an ESG strategy, they had better be able to prove in court that they are running an ESG strategy. Regulators are even more apt to ensure investors are getting what they pay for since the average ESG fund is almost 50% more expensive than the average investment fund.

I believe that investors should consider their ethical investment goals just as carefully as their financial goals. Just as with all goals, these are very personal undertakings, and when tradeoffs exist, those tradeoffs should be carefully considered. In the end, it is incumbent on us, investors and advisors, to navigate these waters and to do our due diligence!

Chart of the Week

Capacity utilization is, in theory, a measure of how much of its potential economic capacity the US is using. A little-talked about figure, it can give some insight into the underlying fundamentals of the economy. Other than 2008 (which was a financial-driven recession), this figure tends to decline leading into recessions. At the moment, it is at its highest levels in over 15 years.

This is an odd economic environment, to be sure. I am cautious to rely too heavily on indicators that worked pre-2020 as I believe post-2020 is a different paradigm. Even so, the underlying economy appears to be fairly robust, despite the headlines.

This document is a general communication being provided for informational purposes only. It is educational in nature and not designed to be taken as advice or a recommendation for any specific investment product, strategy, plan feature or other purpose in any jurisdiction, nor is it a commitment from Directional Advisors to participate in any of the transactions mentioned herein. Any examples used are generic, hypothetical and for illustration purposes only. This material does not contain sufficient information to support an investment decision and it should not be relied upon by you in evaluating the merits of investing in any securities or products. In addition, users should make an independent assessment of the legal, regulatory, tax, credit, and accounting implications and determine, together with their own financial professionals, if any investment mentioned herein is believed to be appropriate to their personal goals. Investors should ensure that they obtain all available relevant information before making any investment. Any forecasts, figures, opinions or investment techniques and strategies set out are for information purposes only, based on certain assumptions and current market conditions and are subject to change without prior notice. All information presented herein is considered to be accurate at the time of production, but no warranty of accuracy is given and no liability in respect of any error or omission is accepted. It should be noted that investment involves risks, the value of investments and the income from them may fluctuate in accordance with market conditions and taxation agreements and investors may not get back the full amount invested. Both past performance and yields are not reliable indicators of current and future results.

What I Care About This Week | 2022 June 27

by Franklin J. Parker, CFA

The Summary

  • This morning we saw data on the pending sales of homes, which surprised to the upside: +0.7% vs. -3.7% expected. This is the first positive figure since October 2021. Looking ahead, we get data on home prices, consumer confidence (another drop expected), personal incomes and consumption, and a couple of indices on manufacturing. Overall a pretty busy week in data. With data we have seen this quarter, the narrative of slower growth is gaining traction. And, although the word is thrown around a lot lately, the evidence of a looming recession is scant (of course, that isn’t to say a recession cannot happen anyway).

  • Ever-more isolated by sanctions, for the first time in 100 years Russia officially defaulted on her debt this weekend. Thanks to ongoing oil and gas payments, Russia does have the cash to pay the overdue interest payments, but is not able to transfer payments to bondholders due to sanctions. Technically this is a default, though Russian officials have pushed back on that word. The significance of a major economy failing to make interest payments on its sovereign debt cannot be understated. Despite the situation, it does hurt the general confidence of market participants, and it is a stark reminder of very real (and often forgotten) political risk.

  • Markets have rallied strongly over the past week, yet the S&P 500 still remains almost 20% off of its highs. If the US economy is or is about to be in a recession, last week’s rally will be one of many bear market rallies on the way down. If, however, a recession is not forthcoming, I would expect markets to continue higher. How you view the current economy will inform how you interpret recent market rallies (and selloffs). As always, understanding these events through the lens of the data is of paramount importance. While our feelings get loud during times like this, they are not a good guide for strategy in their raw form.

The Details

Let’s talk about what is going on with cryptocurrencies.

Bitcoin, a good proxy for the crypto market as a whole, is down almost 70% from last year’s high. Using traditional lines of thinking, this should not be the market reaction to higher inflation. Inflation is, at heart, a loss of value in your domestic currency. Meaning other currencies should gain in value. Were bitcoin a traditional currency, this line of thinking might apply.

However, bitcoin (and other crypto assets) are not traditional currencies. Rather, as their recent price action has shown, they are very risky assets. As such, they are governed more by liquidity flows than traditional valuation models. Let’s dig into that a bit.

Cash flows across markets in fairly predictable ways. During times of cash inflows, investors allocate to safer assets first, then they allocate cash to risky assets (like stocks or high yield bonds), then they allocate to more speculative markets (like angel investments, hedge funds, or cryptocurrencies). When cash flows away from investors, it is pulled from the last market first. So, speculative investments get liquidated first, then risky investments, then safer investments.

In many ways, this makes crypto a sort of “canary in the coal mine.” The selloff began there first because it is a liquid and speculative investment. As cash flowed away from investors, they began to re-allocate away from these markets and into others (pushing stocks higher and crypto down). Of course, cash kept flowing away from investors (in the form of quantitative tightening and inflation) so that selloff continued into risky markets. Now with less cash available to it than before, prices in this market may struggle to regain their previous levels (at least until cash begins to move back toward investors).

And, of course, as good times turn to bad times, we find out which organizations have the fortitude and foresight to survive. This is a good thing, long term, for that marketplace. After this, the crypto market should be a somewhat less speculative place to be.

Chart of the Week

The Federal Reserve has repeatedly talked about inflation expectations as a source of policy frustration. Along with very real policy tools, the Fed actively attempts to influence sentiment among both market participants and the general public. A public that believes inflation will continue marching higher is a public that will actively push inflation higher through the aggregation of their individual actions.

So, charts like this week’s are not good news to the Fed. As consumer sentiment has plunged, expectations for inflation—across both 1-year and 5-year windows—have increased substantially. As a keen observer will note, as inflation expectations increase, the general mood among consumers tends to decrease.

This document is a general communication being provided for informational purposes only. It is educational in nature and not designed to be taken as advice or a recommendation for any specific investment product, strategy, plan feature or other purpose in any jurisdiction, nor is it a commitment from Directional Advisors to participate in any of the transactions mentioned herein. Any examples used are generic, hypothetical and for illustration purposes only. This material does not contain sufficient information to support an investment decision and it should not be relied upon by you in evaluating the merits of investing in any securities or products. In addition, users should make an independent assessment of the legal, regulatory, tax, credit, and accounting implications and determine, together with their own financial professionals, if any investment mentioned herein is believed to be appropriate to their personal goals. Investors should ensure that they obtain all available relevant information before making any investment. Any forecasts, figures, opinions or investment techniques and strategies set out are for information purposes only, based on certain assumptions and current market conditions and are subject to change without prior notice. All information presented herein is considered to be accurate at the time of production, but no warranty of accuracy is given and no liability in respect of any error or omission is accepted. It should be noted that investment involves risks, the value of investments and the income from them may fluctuate in accordance with market conditions and taxation agreements and investors may not get back the full amount invested. Both past performance and yields are not reliable indicators of current and future results.

What I Care About This Week | 2022 June 20

by Franklin J. Parker, CFA

The Summary

  • After the data and event deluge of the past two weeks, this week seems relatively calm. Home sales, durable goods orders, and consumer sentiment are the big data points. Consumer sentiment is expected to fall quite a bit as inflation and a gloomier outlook begin to take hold.

  • The Federal Reserve raised rates quite aggressively last week, opting for a 0.75% hike. This was on the heels of the previous weeks’ surprising jump in inflation. Markets reacted negatively, largely because the Fed had originally set the expectation for a 0.50% rate hike and had to update their guidance during their blackout period (a time when Fed participants are not allowed to speak to media). In order to update their messaging, the Fed quietly leaked their intent to the Wall Street Journal, causing some confusion and frustration among market participants. The Fed noted their surprise with inflation’s persistence, and reiterated their commitment to getting it under control. While explicitly stating the opposite, the Fed’s economic projections seem to indicate their willingness to tolerate a recession to get inflation back to their target.

  • Speaking of recession, it seems that everyone is suddenly talking about one. With the first quarter posting negative growth, we would only need to see the second quarter post negative growth and we have a recession (so, we could already be in one). Despite this, I do not see a recession within the next six months (I pull some highlights from my recession dashboard below). There are serious headwinds for markets, of course, and new data may post in the next few months, but for now I do not see the economy slipping. More in this week’s Details.

The Details

A recession is defined as two quarters in a row of negative GDP growth. With so much talk of a recession in the financial press, I find myself scratching my head to locate the data to support this view. While I realize this is a minority opinion, I do not see a recession within the next six months. Here are a few of my go-to indicators to get a sense of when a recession is on the horizon. In all of the charts below, the grey bars indicate recessions.

Purchasing Manufacturer’s Index. Manufacturing tends to decline ahead of a recession, which is demonstrated in this chart. For this indicator, anything above 50 is expansion and anything below 50 is a contraction. Notice how manufacturing tends to slow and contract ahead of a recession. It would be very odd to have a recession with the strong expansion we are currently experiencing in manufacturing.

Manufacturers’ Backlog of Orders. Similar to PMI, manufacturers tend to see their order book decline considerably leading into a recession (this index reads the same as PMI: >50 is more backlogs, <50 is less). This makes sense as order backlogs would indicate high demand for goods. It would be unusual to have a recession with order backlogs as high as they are.

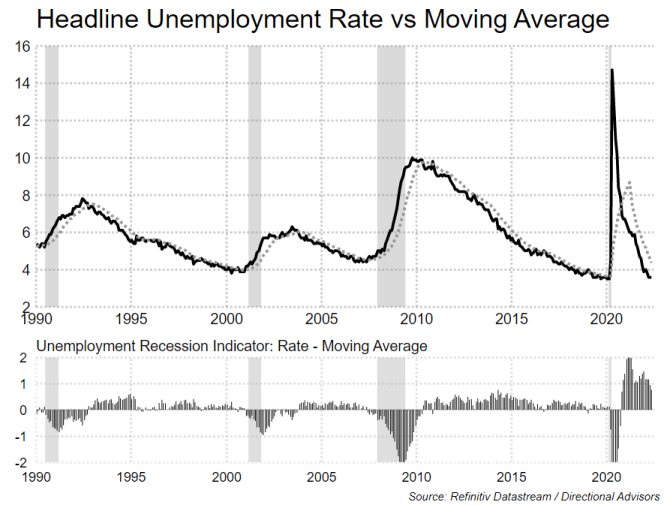
Unemployment Rate. Another look at the health of the economy is the unemployment rate. It is not so much the headline rate that matters, rather it is the general trend in which unemployment is headed. Typically, leading into a recession, unemployment (solid line) moves above its 12-month moving average (dotted line). Currently, the unemployment rate is well below its moving average—largely because employment improved so rapidly coming out of the lockdowns. Again, it would be unusual to have a recession with employment so strong.

Job Openings as a Percent of the Population. Another look at the health of the labor market is to look at the number of job openings as a percentage of the labor force. Typically leading into a recession, we see the number of job openings decline (which is shown in the subplot below). In this environment, job openings are at multi-decade highs, and the number of jobs available, as compared to a year ago, is considerably higher. It is some of the fastest growth on record. It would be unusual to see an economic contraction with the labor market as strong as it is.

GDP Output Gap. Lastly, we look at the difference between actual GDP and potential GDP. Potential GDP is what our economy could theoretically produce, given all the inputs. Actual GDP is, of course, what has been actually produced. What we tend to see leading into recessions is that actual output outpaces theoretical output—a sign that the economy is overheating. This shows up as a negative value on the chart. In fact, this is one of the earliest indicators we get of looming recessions, often giving signals years in advance of the actual recession. What we see currently is that output is still well below the economy’s theoretical capability. Again, it would be unusual to see a recession with a positive output gap.

Yield Curve. The most widely followed recessionary indicator is the yield curve. In a normal environment, you get paid more to tie up your money for 30 years than you do to tie it up for 3 months. Ahead of a recession, that relationship tends to invert. I like to look at the difference between the yield on 30-year US Treasuries and 3-month US T-bills. As you can see, this difference tends to turn negative ahead of recessions. At the moment, it is at non-recessionary levels and has been trending higher (It is true that other parts of the yield curve are inverted, but I find those to be much noisier).

Of course, all of this data is changing rapidly, and when new data comes in I will update my view. For now, however, I am struggling to see a recession in the near-term. Which means that (1) if no recession hits the current market is likely near a bottom, and (2) if a recession does hit it is likely to be fairly mild.

As I have repeatedly talked about, flexibility is key in this environment. We must be able to update our views and portfolios in the face of ongoing changes. And that is what I will do.

This document is a general communication being provided for informational purposes only. It is educational in nature and not designed to be taken as advice or a recommendation for any specific investment product, strategy, plan feature or other purpose in any jurisdiction, nor is it a commitment from Directional Advisors to participate in any of the transactions mentioned herein. Any examples used are generic, hypothetical and for illustration purposes only. This material does not contain sufficient information to support an investment decision and it should not be relied upon by you in evaluating the merits of investing in any securities or products. In addition, users should make an independent assessment of the legal, regulatory, tax, credit, and accounting implications and determine, together with their own financial professionals, if any investment mentioned herein is believed to be appropriate to their personal goals. Investors should ensure that they obtain all available relevant information before making any investment. Any forecasts, figures, opinions or investment techniques and strategies set out are for information purposes only, based on certain assumptions and current market conditions and are subject to change without prior notice. All information presented herein is considered to be accurate at the time of production, but no warranty of accuracy is given and no liability in respect of any error or omission is accepted. It should be noted that investment involves risks, the value of investments and the income from them may fluctuate in accordance with market conditions and taxation agreements and investors may not get back the full amount invested. Both past performance and yields are not reliable indicators of current and future results.

What I Care About This Week | 13 June 2022

by Franklin J. Parker, CFA

The Summary

  • It is the Fed’s meeting week, and markets are on the edge of their seat. There has been generally a more hawkish tone from Fed officials lately, with a willingness to push unemployment higher in an effort to get inflation under control. Of course, unemployment only tends to rise during recessions, so effectively the Fed is communicating their willingness to push the economy into recession in order to tackle the inflation problem. Markets have priced-in two 0.50% rate hikes and one 0.75% rate hike by September. That is considerably more aggressive than previously thought.

  • Inflation is a problem. Last week, inflation posted at the highest level in 40 years, 8.6%. This spooked markets (mainly because of the expected reaction from the Fed), pushing 10-year Treasury yields well into the 3% range. In addition, the yield on the 2-year US Treasury moved higher than the 10-year US Treasury (known as a yield curve inversion). This is a widely-followed recessionary indicator, although it is considerably noisier than the 10-year minus the 3-month US Treasury yield (which is the indicator I follow, and it is not showing recessionary signals).

  • In addition to the Fed, this week we get producer prices (another gauge of inflationary levels), retail sales, and industrial production. Retail sales is an important figure: if demand in the economy begins to wane, a recession will be much more likely. Of course, most of this data will be completely overshadowed by the Federal Reserve meeting, rate announcement, and press conference on Wednesday.

The Details & Chart of the Week

I admit, this market has gotten a bit nasty.

Investors have grown very concern about ever-increasing inflation, and the Fed’s response to this problem. Last week’s higher-than-expected inflation print pushed markets over the edge.

My view has been that, barring a recession, the S&P 500 would log a low around the 3900 level. Looking at a chart of the S&P 500 (and applying some basic technical analysis), we can see that there were buyers in the 3800 range and above since at least mid-2021. Today’s break below 3800 signals that those buyers have moved to a lower price. The next level that might offer some support is the mid-3500 range—a full 6% lower than current price. If markets get there, that would be a 26% total drawdown from the S&P 500’s peak—a very rare event outside of a recession. Also working against stocks in the short term is the downward channel that has very clearly formed since the start of the year.

In short, the short-term picture looks rough, with a new possible bottom getting logged somewhere around 3500 and sometime between July and October. Of course, these short-term swings are notoriously hard to predict, and a single news item can turn the whole thing around. The Fed’s meeting on Wednesday, for example, may offer an upside surprise to markets which have begun to price in a possibly overly pessimistic view of Fed actions.

The big question is: are we in a recession, and, if so, how long would it last? My view is that we are not. Employment is still very strong, consumer demand remains high, and credit is still flowing. If this is a recession (and it might be!), it would be a very strange one. Last quarter’s GDP posting, showing a contraction, might give investors some clue as to a potential cause. Government spending is down considerably from this time last year, and that could be enough to drag the economy into a technical recession, even if the fundamentals look decent.

If this is not a demand-induced recession (i.e. fewer people working and buying things), then I still see a run-up into the end of the year. But, as I have said many times before, flexibility is key in this environment. As we get new data, we must update our view and our portfolios.

This document is a general communication being provided for informational purposes only. It is educational in nature and not designed to be taken as advice or a recommendation for any specific investment product, strategy, plan feature or other purpose in any jurisdiction, nor is it a commitment from Directional Advisors to participate in any of the transactions mentioned herein. Any examples used are generic, hypothetical and for illustration purposes only. This material does not contain sufficient information to support an investment decision and it should not be relied upon by you in evaluating the merits of investing in any securities or products. In addition, users should make an independent assessment of the legal, regulatory, tax, credit, and accounting implications and determine, together with their own financial professionals, if any investment mentioned herein is believed to be appropriate to their personal goals. Investors should ensure that they obtain all available relevant information before making any investment. Any forecasts, figures, opinions or investment techniques and strategies set out are for information purposes only, based on certain assumptions and current market conditions and are subject to change without prior notice. All information presented herein is considered to be accurate at the time of production, but no warranty of accuracy is given and no liability in respect of any error or omission is accepted. It should be noted that investment involves risks, the value of investments and the income from them may fluctuate in accordance with market conditions and taxation agreements and investors may not get back the full amount invested. Both past performance and yields are not reliable indicators of current and future results.

What I Care About This Week | 2022 May 31

by Franklin J. Parker, CFA

The Summary

  • This week gives us some insights on the financial health of US families. Today we see figures for home prices, tomorrow we see the number of job openings (11.4 million openings are expected), weekly initial jobless claims post on Thursday, and on Friday we see average earnings and the headline unemployment number, which is expected to tick slightly down to 3.5%. All in all, this is an important week for data.

  • Last week’s rally brought US stocks higher, led by downtrodden tech shares. The rally was positive from a technical perspective, showing strength after several weeks of weakness. However, volume has been lower indicating there may not be as much momentum behind the move as there otherwise would be.

  • Given that I see a low probability of recession this year, it is my view that markets have either bottomed or are very close to doing so. Stocks rallied strongly after touching the 20% down mark. Whether or not those buyers stick around is an open question, of course, but downswings in excess of 20% outside of recessions are very rare, historically. That said, if the S&P 500 starts to break below the 3800 level, prices may struggle to find support. As I have said for a while now, flexibility and adaptability are key in this environment.

The Details

Imagine for a minute that you are in an airplane when the engine catches fire. The panic is palpable. The feeling of helplessness, the angst over your immediate future…

While I am not a pilot, I have always imagined that the pilot must have the same panic as everyone else on the airplane in that scenario. The pilot, however, has one distinct advantage over the passengers: she has a checklist to run in that kind of emergency. While she may feel the angst, she does not let it drive her decision-making. Rather, she turns to a pre-thought-out series of steps that will ensure the situation ends as well as it can given that an engine is on fire.

Which illustrates the importance of a cohesive investment strategy, and the discipline to follow it. A cohesive strategy is that checklist that tells you what to do in any market scenario. Just like the pilot, we might feel considerable angst, but we must keep ourselves disciplined to follow the pre-thought-out series of steps that will ensure the best outcome, given the market scenario.

Without that checklist, that cohesive strategy, we are left to cast about wondering what to do, listening to any and all thoughts on the matter. Can you imagine our pilot having the passengers debate how to handle an engine fire!?

I find it helpful, from time to time, to remind ourselves of the basics. A cohesive investment strategy must be a central feature to any interaction with markets. Without it, we are left to cast about during the inevitable times of market turbulence. And that kind of behavior can quickly threaten our future goals!

Chart of the Week

Valuations, at least as measured by price-to-earnings ratios, have come down quite a bit over the past six months or so. This has been a global trend in keeping with the coordination of central banks to tighten the money supply, as this week’s chart demonstrates. US markets still command a premium, though even that premium has contracted a bit. A return to pre-2015 valuations would be a welcome sight for investors struggling to deploy cash at valuations sitting around multi-decade highs.

This document is a general communication being provided for informational purposes only. It is educational in nature and not designed to be taken as advice or a recommendation for any specific investment product, strategy, plan feature or other purpose in any jurisdiction, nor is it a commitment from Directional Advisors to participate in any of the transactions mentioned herein. Any examples used are generic, hypothetical and for illustration purposes only. This material does not contain sufficient information to support an investment decision and it should not be relied upon by you in evaluating the merits of investing in any securities or products. In addition, users should make an independent assessment of the legal, regulatory, tax, credit, and accounting implications and determine, together with their own financial professionals, if any investment mentioned herein is believed to be appropriate to their personal goals. Investors should ensure that they obtain all available relevant information before making any investment. Any forecasts, figures, opinions or investment techniques and strategies set out are for information purposes only, based on certain assumptions and current market conditions and are subject to change without prior notice. All information presented herein is considered to be accurate at the time of production, but no warranty of accuracy is given and no liability in respect of any error or omission is accepted. It should be noted that investment involves risks, the value of investments and the income from them may fluctuate in accordance with market conditions and taxation agreements and investors may not get back the full amount invested. Both past performance and yields are not reliable indicators of current and future results.

What I Care About This Week | 2021 May 10

by Franklin J. Parker, CFA

The Summary

  • This week is a busy one for fundamental economic data. Inflation for April posts on Wednesday, which is the big news item. We also get several Fed speeches, job openings data (JOLTS), and industrial production.

  • Last week’s big jaw-dropper was April’s new jobs figures. Economists expected 1,000,000 jobs to have been created in April, instead only 266,000 jobs were created. This generated considerable buzz in the financial press, and generated speculation that the Fed may keep current policy on the table for longer. This is generally good for risk assets (like stocks) which benefit from money-printing. Commodity prices jumped in the wake of that report. Ironically, higher commodity prices should push inflation higher (which slows the Fed’s ability to print money).

  • Earnings season is mostly wrapped up (88% of the S&P 500 has reported), and the results are very good—companies are reporting earnings about 22% higher than expected, which is the highest since FactSet began tracking the metric in 2008. The biggest winners have been Financials (94% beat expectations) and Technology (93% beat expectations). The notable figure, however, is earnings growth. For the first quarter, earnings growth has posted about 49% year-over-year. Of course, much of this growth is due to Covid’s effect on the figures last year at this time, but it is a strong indication that the reopening of the economy is good for investors.

Chart of the Week

Commodities have been on a tear lately. Just this morning, iron ore jumped 10%. Copper just hit an all-time high. And lumber… Lumber has increased by 377% over the past year.

Up to now, however, this increase in commodity prices has not led to an increase in core inflation (which factors out food and energy costs–the Fed’s preferred measure). Since everything we buy is built with some base commodity, why haven’t commodity prices translated into higher prices?

One answer is that it takes time for higher prices to make their way through the production chain. Companies don’t like to raise prices because it dents a consumer’s ability to buy their product. So, they hope that higher material costs are temporary and operate with thinner profit margins. Once the higher prices are psychologically set, however, they acquiesce and pass along the higher price to consumers.

Another answer is production methods. Increased automation has helped to make up for the most expensive component of the production process: labor. By investing in automated production, companies have been able to offset higher raw material costs.

Yet another answer is that all of this has happened so fast that companies simply haven’t reacted yet. Higher prices are coming, then, just as soon as everyone gets their databases updated.

I expect that the answer is a little of all three (but mostly the last one, in my view). The $10 trillion question to investors is just how much this will affect the Fed’s policy of money-printing. Will they view inflation from higher commodity prices as “transient” or a legitimate concern they need to address? If inflation hits before employment is back to full speed, will they favor employment or tamping down inflation? How will they handle our current liquidity trap dynamics and pull the cash out of the system without raising rates?

There are quite a few unanswered questions, each with very important implications for investors’ portfolios. At the moment, we need to take the data as it comes—just one week at a time.

This document is a general communication being provided for informational purposes only. It is educational in nature and not designed to be taken as advice or a recommendation for any specific investment product, strategy, plan feature or other purpose in any jurisdiction, nor is it a commitment from Directional Advisors to participate in any of the transactions mentioned herein. Any examples used are generic, hypothetical and for illustration purposes only. This material does not contain sufficient information to support an investment decision and it should not be relied upon by you in evaluating the merits of investing in any securities or products. In addition, users should make an independent assessment of the legal, regulatory, tax, credit, and accounting implications and determine, together with their own financial professionals, if any investment mentioned herein is believed to be appropriate to their personal goals. Investors should ensure that they obtain all available relevant information before making any investment. Any forecasts, figures, opinions or investment techniques and strategies set out are for information purposes only, based on certain assumptions and current market conditions and are subject to change without prior notice. All information presented herein is considered to be accurate at the time of production, but no warranty of accuracy is given and no liability in respect of any error or omission is accepted. It should be noted that investment involves risks, the value of investments and the income from them may fluctuate in accordance with market conditions and taxation agreements and investors may not get back the full amount invested. Both past performance and yields are not reliable indicators of current and future results.

What I Care About This Week | 2021 May 3

by Franklin J. Parker, CFA

The Summary

  • The Purchasing Manufacturer’s Index (PMI) posts today, Non-Manufacturing PMI posts Wednesday, and unemployment posts Friday. PMIs are a measure of business activity, and while manufacturing is only about 10% of the US economy, it has been used as a bellwether. Since the Covid lockdowns, Non-Manufacturing PMI is arguably more important as it measures the services sector. Of course, the headline unemployment rate is both an important measure of the recovery and an important data point for the Federal Reserve.

  • Speaking of the Federal Reserve, the Federal Open Market Committee (FOMC) met last week. They kept current policy going, of course. Chairman Powell’s press conference was more of the same: current policy of low interest rates and quantitative easing (QE) will remain in place until “substantial further progress has been made.” According to Powell, the Fed needs to see “a string” of positive data before they are sure that the economy is on proper footing. With $120 billion per month at stake, what is “a string”? More than one—beyond that Powell declined to comment. Markets have priced-in a beginning to the end of QE in Q3 or Q4 of this year, and an interest rate hike in Q2 to Q3 of next year. Substantial change to that outlook—either from the data or the Fed—would likely move markets.

  • Earnings season continues apace! 60% of the S&P 500 companies have reported, and they are reporting earnings about 23% above expectations—the highest since at least 2008, according to FactSet. The S&P 500’s blended earnings growth rate stands at 46% for Q1, though much of that can be attributed to poor earnings posted in Q1 of last year due to Covid. This is encouraging, however, as it appears companies are recovering quite well. If/when the Fed backs away, it will be on companies to grow earnings to keep markets going. A signal that they can do that bolsters market confidence!

The Details

Where is inflation?

Any traditional economic theory would suggest that a serious inflation problem is on the horizon. In its simplest form, inflation is the Price Level in this equation:

Amount of Money x Velocity of Money = Price Level x Real GDP

We know that the Amount of Money variable has increased by about 28% over the past year (the most on record), and Real GDP, year-over-year, is about the same. Yet the price level has only increased about 2%. According to our formula, our price level should be about 25% higher—so where is inflation?

The answer is that the Velocity of Money has cratered. Because money is changing hands less often, inflation has remained muted. Even more fascinating: the velocity of money has decreased from about 1.6 to about 1.15—down 28% over the past year, which is almost exactly equal to the expansion of the supply of money over the past year. In other words, no matter how much cash the Fed prints it gets saved and not spent (given the size of the figures, the word “hoarded” comes to mind).

But why? Why is all of this cash being hoarded? This is the $10 trillion question!

In my view, investors are hoarding cash because there is no opportunity cost to holding it. Rather than invest in a bond at 1.5%, investors are more willing to simply hold the cash because it gives future optionality (we can do something with it tomorrow). Because interest rates are so low, the weighted average cost of capital (WACC) of companies is much lower than it has been historically. Because the WACC is the minimum rate any corporate investment must earn, companies are not punished for holding cash, either. Finally, banks don’t want to lend because they make very little profit on loans under 4%, so they end up holding cash, as well.

All of this cash, then, is getting “stuck” on the balance sheets of investors, companies, and banks. It will continue to be “stuck” until the opportunity cost of holding cash comes back. Only when investors, companies, and banks, are paid to put it to use will cash actually get put to use!

Counterintuitively, cash gets put to use when interest rates rise. When we can invest in bonds at 4%+, investors can no longer afford to hold cash because they are missing out on real return. This also increases the WACC of companies making cash drag unaffordable. Finally, at higher rates, banks miss out on real profits when if they hold cash rather than lend it. When interest rates meaningfully rise, then, everyone responds to that incentive simultaneously: investors deploy cash into financial instruments, companies spend their cash on employees, R&D, Capital Expenditures; banks begin to lend to everyone they can. Suddenly the velocity of money begins to increase quickly!

And that is when inflation rears its ugly head.

In the end, the Fed must decrease the supply of money before they raise interest rates meaningfully. Historically, of course, higher interest rates is how the Fed fought inflation. In this environment, higher rates cause inflation.

I assume that the Fed has read much of the same research I have (this framework was put together by a Fed economist back in 2014, in fact). Even so, investors must watch both the Fed and the data closely to ensure that (1) this framework is a correct assessment of the current environment, and (2) that the Fed is managing their transition to “normal” policy effectively.

As we bring this unprecedented economic experiment to a close—at least ostensibly—investors must remain vigilant to the big forces affecting their portfolios. Inflation is a macro force that we have had the luxury of ignoring for the past several decades. Given the current environment, however, inflation could very quickly become an investor’s #1 risk.

This document is a general communication being provided for informational purposes only. It is educational in nature and not designed to be taken as advice or a recommendation for any specific investment product, strategy, plan feature or other purpose in any jurisdiction, nor is it a commitment from Directional Advisors to participate in any of the transactions mentioned herein. Any examples used are generic, hypothetical and for illustration purposes only. This material does not contain sufficient information to support an investment decision and it should not be relied upon by you in evaluating the merits of investing in any securities or products. In addition, users should make an independent assessment of the legal, regulatory, tax, credit, and accounting implications and determine, together with their own financial professionals, if any investment mentioned herein is believed to be appropriate to their personal goals. Investors should ensure that they obtain all available relevant information before making any investment. Any forecasts, figures, opinions or investment techniques and strategies set out are for information purposes only, based on certain assumptions and current market conditions and are subject to change without prior notice. All information presented herein is considered to be accurate at the time of production, but no warranty of accuracy is given and no liability in respect of any error or omission is accepted. It should be noted that investment involves risks, the value of investments and the income from them may fluctuate in accordance with market conditions and taxation agreements and investors may not get back the full amount invested. Both past performance and yields are not reliable indicators of current and future results.

Exit mobile version
%%footer%%