What I Care About This Week | 2021 May 24

by Franklin J. Parker, CFA

The Summary

  • The Federal Open Market Committee’s minutes were posted last week, and markets were a bit surprised at the hawkishness of several members (“hawkishness” = concern about inflation). Several FOMC members said that “it might be appropriate at some point in upcoming meetings to begin discussing a plan for adjusting the pace of asset purchases” given the recent progress in the economic recovery. This made investors wonder whether the current program of money-printing (also called “quantitative easing,” or QE) would be ending sooner than expected, and a repricing of risk assets resulted.

  • First-time jobless claims fell to their lowest level since the COVID-induced recession began, with 444,000 people claiming weekly benefits. If the Fed can pare market expectations for QE in a gentle way, then economic growth figures will once again be good news. At the moment, however, good economic figures may be bad news for stock prices.

  • Data on durable goods orders are released Thursday, along with consumer sentiment and personal income data on Friday. These are important metrics, though it is expected that personal incomes shrank now that stimulus checks have been distributed. Consumer sentiment will be important to see, as will personal spending data, as both of those directly relate to the “reopening trade.” As the economy reopens fully, and people are willing to go do things, we should see these figures begin to tick upward.

The Details

Earnings growth over the past quarter has been an encouraging development. More encouraging is that, rather than further extend prices (and thus valuations), investors have largely kept prices steady. This means that stocks are growing into their high valuations. At first blush this is a frustration for investors. However, if we think of valuations in the context of the commonly-used metric, the P/E ratio (price-to-earnings ratio, or the multiple investors are willing to pay for every dollar of corporate earnings), there are only two ways high valuations can normalize.

The first way is what we are seeing currently—prices remain steady while corporate earnings increase. This means the “E” in the P/E ratio increases while the “P”—price—stays the same. The overall valuation metric contracts because the number in the denominator is bigger while the numerator stays the same.

The second way valuations can contract is that the “P,” or price, can contract. This would also lower valuations, but at the cost of lower prices.

While watching markets stall-out can be frustrating, it is actually healthy because it gives valuations a chance to normalize, at least a little, in a way that doesn’t involve prices dropping. So, while frustrating, it is better than the alternative!

As I mentioned last week, rising interest rates as well as an end to quantitative easing by the Fed will both serve to shrink valuations. Earnings growth, then, is the only mechanism which can stabilize prices. Further progress on that front—espeically over the next two quarters—will be key.

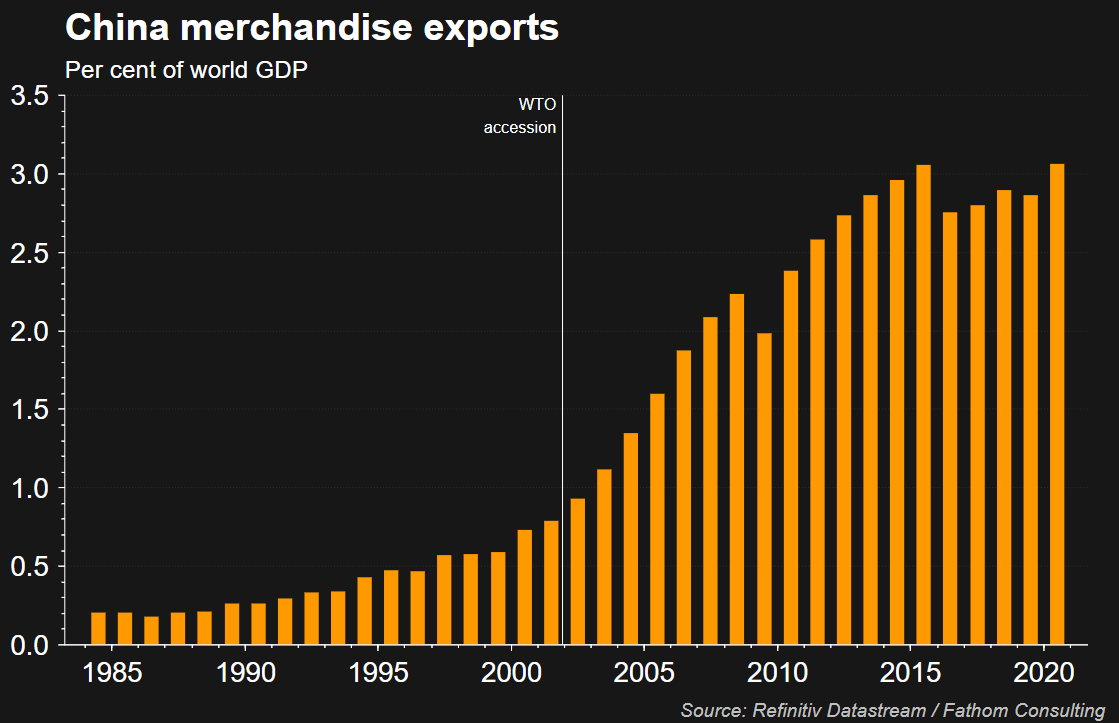
Chart of the Week

There are multiple types of inflation. The first type, which most of us associate with inflation, is the monetary type: all else equal, more cash in circulation leads to higher prices for goods and services. The second type of inflation is demand-pull inflation: wealthier consumers demand more goods and services, and constrained manufacturing capacity creates higher prices. The third type of inflation is cost-push inflation: the inputs to manufacturing (like labor or commodities) get more expensive, leading to an increase in price to consumers.

Over the past 30 years or so, rather than raise prices, globalization has allowed companies to simply shift their production overseas, and this has been a severely overlooked factor holding back inflation. China’s percent of global GDP illustrates this quite well. As China gained more and more global manufacturing marketshare, the prices of consumer goods has been held low because manufacturing supply has grown substantially—holding demand-pull and cost-push inflation at bay. China’s rapid expansion of manufacturing capacity has given global companies a place to shift production to hold down their most expensive input: labor costs, and they have chosen to do this rather than raise prices. That shift peaked in 2015 and has begun to reverse, and as global economies begin to decouple from Chinese manufacturing, a significant deflationary factor may begin to subside. Of course, it may also be replaced by other low-cost manufacturers (like India, Singapore, Viet Nam, etc).

In any case, there is at least an argument to be made that existing deflationary pressures may have peaked and demand-pull/cost-push inflation may begin to exert an influence on consumer prices. Of more interest to me: 30 years is an entire career, so the veterans of finance have never managed money in an inflationary environment, and many will be reluctant to shift their thinking should that become necessary.

As I have often said, mental flexibility is one of the most important attributes investors can have, and I wonder if our current environment may be about to prove me right.
Image

This document is a general communication being provided for informational purposes only. It is educational in nature and not designed to be taken as advice or a recommendation for any specific investment product, strategy, plan feature or other purpose in any jurisdiction, nor is it a commitment from Directional Advisors to participate in any of the transactions mentioned herein. Any examples used are generic, hypothetical and for illustration purposes only. This material does not contain sufficient information to support an investment decision and it should not be relied upon by you in evaluating the merits of investing in any securities or products. In addition, users should make an independent assessment of the legal, regulatory, tax, credit, and accounting implications and determine, together with their own financial professionals, if any investment mentioned herein is believed to be appropriate to their personal goals. Investors should ensure that they obtain all available relevant information before making any investment. Any forecasts, figures, opinions or investment techniques and strategies set out are for information purposes only, based on certain assumptions and current market conditions and are subject to change without prior notice. All information presented herein is considered to be accurate at the time of production, but no warranty of accuracy is given and no liability in respect of any error or omission is accepted. It should be noted that investment involves risks, the value of investments and the income from them may fluctuate in accordance with market conditions and taxation agreements and investors may not get back the full amount invested. Both past performance and yields are not reliable indicators of current and future results.

What I Care About This Week | 2021 May 17

by Franklin J. Parker

The Summary

  • This week is a pretty light on data—earnings are mostly done, and there isn’t much fundamental economic data posting. Of course, initial unemployment claims will be important, and the Federal Open Market Committee (FOMC) minutes post on Wednesday. Investors will parse those minutes for clues as to how members see the economy and policy evolving over the coming year.

  • Last week was a big week for data. Namely, markets got figures for April’s job creation and inflation. Inflation was a surprise, with many pockets of goods and services beginning to see considerable upward price pressure. Prices for used cars and trucks, for example, jumped 10% over last month! The Fed has repeatedly stated that they fully expect short-term inflation pressure, but that they expect it to be transient. In that context, the recent inflation report is not of particular concern, however, investors must decide if they believe what the Fed has said, or if they think the Fed’s hand will be forced sooner than they have planned.

  • Looking ahead, there is a bit of a respite from market-moving data. However, we are coming into late May and there is an old saying: “sell in May and go away.” Should investors heed that advice? I’m inclined to say “no.” My general thesis is that so long as the Fed is printing money, the bias in market prices is up, and the Fed is still printing money. While the summer is typically more volatile than the rest of the year, it can also deliver significant gains. If you had sold last year around this time, you would have missed out on 23% gains in the S&P 500 (and bought just in time for markets to go down 10%).

The Details & Chart of the Week

Let’s talk about stock valuations.

Obviously, stock valuations are extremely high. In fact, by one popular measure, stocks are more expensive than 95% of their history. Historically, stocks tend to deliver subpar longer-term performance when valuations are this stretched. Of course, valuations can remain stretched for quite some time (as they were in the late 1990s), so we can’t use valuations as a short-term timing mechanism.

S&P 500 CAPE Ratio

But this does bring up the question of valuations—specifically what might cause them to shift back to normal. In a normal environment, investors would shift their valuation of stocks in direct proportion to their view of earnings growth. As you can see from the chart below, earnings growth affects the multiple investors are willing to pay for cashflows. For example, as growth expectations shift from 10% to 7.5%, investors would decrease their current valuation of stocks by 23%, all else being equal.

Relationship between earnings growth and valuation.
note: the actual number representing “valuation” is not important, it is the change in these figures with which we are concerned

Of course, not everything is equal—especially in our current environment! In our current environment, I see at least three factors heavily influencing stock valuations. First, earnings growth is, of course, an important component. Second, low interest rates have served to pushed valuations higher. Third, the Fed’s increase in money supply has further served to stretch valuations. Let’s look at each component in turn (we’ve already considered the first), and then we may have at least some sense of how each component might influence market valuations.

Adding the influence of interest rates adds some complexity to our simplistic model of valuation above. Shifting both earnings growth and interest rates creates some interesting and nonlinear dynamics, as the chart below shows us. It also shows us an important point: valuations may stay high even if interest rates rise. It is not a foregone conclusion that valuations shrink when rates rise, as earnings growth can more than make up the change.

Relationship between stock valuations, earnings growth, and discount rates.

Finally, there is the influence of printing money. This is a considerably more difficult factor to pin down. I do have a framework for thinking about it, though I will be the first to admit it is still experimental, and there are lots of assumptions that must be made. Even so, let’s throw caution to the wind and charge ahead anyway.

Currently, the Federal Reserve is expanding the money supply by about 7.5% per year. Based on our back-of-the-envelope analysis, this yields an increase in market prices of about 3.5%, all else being equal. In other words, we can attribute about 3.5 percentage points of the coming year’s market growth to the Fed printing money at its current pace.

Relationship between money supply and market pricing.

By developing a reasonable forecast for each of these components, we might have a better sense of how the Fed’s actions might affect markets in the coming years.

Based on this rough model, here are the consequences of various actions:

  • For every 1 percentage point upward change in long-term earnings growth expectations, we should expect an 8% upward change in prices.
  • For every 0.5 percentage point move upward in the 10-Year US Treasury yield, we should expect a 5% downward drag on prices.
  • When the Fed stops printing money, we should expect a 4.5% drag on prices.
  • A contraction of 2.5%in the money supply yields a 1.6% drag on prices.

As you can see, the strongest effect on market prices is still earnings growth expectations. However, that single effect can easily be overwhelmed by higher interest rates and an end to current Federal Reserve policy. Of course, as I mentioned, this is a very rough analysis.

The point is, higher interest rates coupled with an end to existing Federal Reserve policy creates a significant headwind for market prices. As I have long said, investors may do well to monitor these data points very closely, and adjust their portfolios accordingly.

As always, I would be delighted to open that conversation with you.

This document is a general communication being provided for informational purposes only. It is educational in nature and not designed to be taken as advice or a recommendation for any specific investment product, strategy, plan feature or other purpose in any jurisdiction, nor is it a commitment from Directional Advisors to participate in any of the transactions mentioned herein. Any examples used are generic, hypothetical and for illustration purposes only. This material does not contain sufficient information to support an investment decision and it should not be relied upon by you in evaluating the merits of investing in any securities or products. In addition, users should make an independent assessment of the legal, regulatory, tax, credit, and accounting implications and determine, together with their own financial professionals, if any investment mentioned herein is believed to be appropriate to their personal goals. Investors should ensure that they obtain all available relevant information before making any investment. Any forecasts, figures, opinions or investment techniques and strategies set out are for information purposes only, based on certain assumptions and current market conditions and are subject to change without prior notice. All information presented herein is considered to be accurate at the time of production, but no warranty of accuracy is given and no liability in respect of any error or omission is accepted. It should be noted that investment involves risks, the value of investments and the income from them may fluctuate in accordance with market conditions and taxation agreements and investors may not get back the full amount invested. Both past performance and yields are not reliable indicators of current and future results.

Wealth Management in the Algocen Era: A Speculative Future

Yvette’s inbox dings at 3:02 pm on 13 May 2038. It’s the list of trades executed by the algorithms that day. A quick review raises no red flags, which is good because she is headed into a sign-on meeting with a new client.

“I need this money in the next four years, and I’m worried about buying stocks while they are at all-time market highs,” Alex, the new client, explains. “And I really don’t want to invest in tobacco or marijuana companies.”

“I’ll include all of that in your investment policy statement,” Yvette says. “I should have the draft to you by tomorrow. Do you have any other concerns?”

The meeting ends and Yvette returns to her desk. The IPS is almost finalized. She just adds the environmental, social, and governance (ESG) restrictions and forwards it to Alex for electronic signature.

Yvette opens her coding integrated development environment (IDE) and revises the algorithm she has written for Alex, excluding tobacco and marijuana companies from Alex’s personal investment universe. Though some of these companies are included in the investment universe of Yvette’s firm, such client-instituted restrictions are fairly common. At 5:38 pm, Yvette forwards Alex’s final algorithm and IPS to compliance for review and then gathers her belongings to head home for the day. [Read more at the CFA Institute’s Enterprising Investor blog…]

What I Care About This Week | 2021 May 10

by Franklin J. Parker, CFA

The Summary

  • This week is a busy one for fundamental economic data. Inflation for April posts on Wednesday, which is the big news item. We also get several Fed speeches, job openings data (JOLTS), and industrial production.

  • Last week’s big jaw-dropper was April’s new jobs figures. Economists expected 1,000,000 jobs to have been created in April, instead only 266,000 jobs were created. This generated considerable buzz in the financial press, and generated speculation that the Fed may keep current policy on the table for longer. This is generally good for risk assets (like stocks) which benefit from money-printing. Commodity prices jumped in the wake of that report. Ironically, higher commodity prices should push inflation higher (which slows the Fed’s ability to print money).

  • Earnings season is mostly wrapped up (88% of the S&P 500 has reported), and the results are very good—companies are reporting earnings about 22% higher than expected, which is the highest since FactSet began tracking the metric in 2008. The biggest winners have been Financials (94% beat expectations) and Technology (93% beat expectations). The notable figure, however, is earnings growth. For the first quarter, earnings growth has posted about 49% year-over-year. Of course, much of this growth is due to Covid’s effect on the figures last year at this time, but it is a strong indication that the reopening of the economy is good for investors.

Chart of the Week

Commodities have been on a tear lately. Just this morning, iron ore jumped 10%. Copper just hit an all-time high. And lumber… Lumber has increased by 377% over the past year.

Up to now, however, this increase in commodity prices has not led to an increase in core inflation (which factors out food and energy costs–the Fed’s preferred measure). Since everything we buy is built with some base commodity, why haven’t commodity prices translated into higher prices?

One answer is that it takes time for higher prices to make their way through the production chain. Companies don’t like to raise prices because it dents a consumer’s ability to buy their product. So, they hope that higher material costs are temporary and operate with thinner profit margins. Once the higher prices are psychologically set, however, they acquiesce and pass along the higher price to consumers.

Another answer is production methods. Increased automation has helped to make up for the most expensive component of the production process: labor. By investing in automated production, companies have been able to offset higher raw material costs.

Yet another answer is that all of this has happened so fast that companies simply haven’t reacted yet. Higher prices are coming, then, just as soon as everyone gets their databases updated.

I expect that the answer is a little of all three (but mostly the last one, in my view). The $10 trillion question to investors is just how much this will affect the Fed’s policy of money-printing. Will they view inflation from higher commodity prices as “transient” or a legitimate concern they need to address? If inflation hits before employment is back to full speed, will they favor employment or tamping down inflation? How will they handle our current liquidity trap dynamics and pull the cash out of the system without raising rates?

There are quite a few unanswered questions, each with very important implications for investors’ portfolios. At the moment, we need to take the data as it comes—just one week at a time.

This document is a general communication being provided for informational purposes only. It is educational in nature and not designed to be taken as advice or a recommendation for any specific investment product, strategy, plan feature or other purpose in any jurisdiction, nor is it a commitment from Directional Advisors to participate in any of the transactions mentioned herein. Any examples used are generic, hypothetical and for illustration purposes only. This material does not contain sufficient information to support an investment decision and it should not be relied upon by you in evaluating the merits of investing in any securities or products. In addition, users should make an independent assessment of the legal, regulatory, tax, credit, and accounting implications and determine, together with their own financial professionals, if any investment mentioned herein is believed to be appropriate to their personal goals. Investors should ensure that they obtain all available relevant information before making any investment. Any forecasts, figures, opinions or investment techniques and strategies set out are for information purposes only, based on certain assumptions and current market conditions and are subject to change without prior notice. All information presented herein is considered to be accurate at the time of production, but no warranty of accuracy is given and no liability in respect of any error or omission is accepted. It should be noted that investment involves risks, the value of investments and the income from them may fluctuate in accordance with market conditions and taxation agreements and investors may not get back the full amount invested. Both past performance and yields are not reliable indicators of current and future results.

What I Care About This Week | 2021 May 3

by Franklin J. Parker, CFA

The Summary

  • The Purchasing Manufacturer’s Index (PMI) posts today, Non-Manufacturing PMI posts Wednesday, and unemployment posts Friday. PMIs are a measure of business activity, and while manufacturing is only about 10% of the US economy, it has been used as a bellwether. Since the Covid lockdowns, Non-Manufacturing PMI is arguably more important as it measures the services sector. Of course, the headline unemployment rate is both an important measure of the recovery and an important data point for the Federal Reserve.

  • Speaking of the Federal Reserve, the Federal Open Market Committee (FOMC) met last week. They kept current policy going, of course. Chairman Powell’s press conference was more of the same: current policy of low interest rates and quantitative easing (QE) will remain in place until “substantial further progress has been made.” According to Powell, the Fed needs to see “a string” of positive data before they are sure that the economy is on proper footing. With $120 billion per month at stake, what is “a string”? More than one—beyond that Powell declined to comment. Markets have priced-in a beginning to the end of QE in Q3 or Q4 of this year, and an interest rate hike in Q2 to Q3 of next year. Substantial change to that outlook—either from the data or the Fed—would likely move markets.

  • Earnings season continues apace! 60% of the S&P 500 companies have reported, and they are reporting earnings about 23% above expectations—the highest since at least 2008, according to FactSet. The S&P 500’s blended earnings growth rate stands at 46% for Q1, though much of that can be attributed to poor earnings posted in Q1 of last year due to Covid. This is encouraging, however, as it appears companies are recovering quite well. If/when the Fed backs away, it will be on companies to grow earnings to keep markets going. A signal that they can do that bolsters market confidence!

The Details

Where is inflation?

Any traditional economic theory would suggest that a serious inflation problem is on the horizon. In its simplest form, inflation is the Price Level in this equation:

Amount of Money x Velocity of Money = Price Level x Real GDP

We know that the Amount of Money variable has increased by about 28% over the past year (the most on record), and Real GDP, year-over-year, is about the same. Yet the price level has only increased about 2%. According to our formula, our price level should be about 25% higher—so where is inflation?

The answer is that the Velocity of Money has cratered. Because money is changing hands less often, inflation has remained muted. Even more fascinating: the velocity of money has decreased from about 1.6 to about 1.15—down 28% over the past year, which is almost exactly equal to the expansion of the supply of money over the past year. In other words, no matter how much cash the Fed prints it gets saved and not spent (given the size of the figures, the word “hoarded” comes to mind).

But why? Why is all of this cash being hoarded? This is the $10 trillion question!

In my view, investors are hoarding cash because there is no opportunity cost to holding it. Rather than invest in a bond at 1.5%, investors are more willing to simply hold the cash because it gives future optionality (we can do something with it tomorrow). Because interest rates are so low, the weighted average cost of capital (WACC) of companies is much lower than it has been historically. Because the WACC is the minimum rate any corporate investment must earn, companies are not punished for holding cash, either. Finally, banks don’t want to lend because they make very little profit on loans under 4%, so they end up holding cash, as well.

All of this cash, then, is getting “stuck” on the balance sheets of investors, companies, and banks. It will continue to be “stuck” until the opportunity cost of holding cash comes back. Only when investors, companies, and banks, are paid to put it to use will cash actually get put to use!

Counterintuitively, cash gets put to use when interest rates rise. When we can invest in bonds at 4%+, investors can no longer afford to hold cash because they are missing out on real return. This also increases the WACC of companies making cash drag unaffordable. Finally, at higher rates, banks miss out on real profits when if they hold cash rather than lend it. When interest rates meaningfully rise, then, everyone responds to that incentive simultaneously: investors deploy cash into financial instruments, companies spend their cash on employees, R&D, Capital Expenditures; banks begin to lend to everyone they can. Suddenly the velocity of money begins to increase quickly!

And that is when inflation rears its ugly head.

In the end, the Fed must decrease the supply of money before they raise interest rates meaningfully. Historically, of course, higher interest rates is how the Fed fought inflation. In this environment, higher rates cause inflation.

I assume that the Fed has read much of the same research I have (this framework was put together by a Fed economist back in 2014, in fact). Even so, investors must watch both the Fed and the data closely to ensure that (1) this framework is a correct assessment of the current environment, and (2) that the Fed is managing their transition to “normal” policy effectively.

As we bring this unprecedented economic experiment to a close—at least ostensibly—investors must remain vigilant to the big forces affecting their portfolios. Inflation is a macro force that we have had the luxury of ignoring for the past several decades. Given the current environment, however, inflation could very quickly become an investor’s #1 risk.

This document is a general communication being provided for informational purposes only. It is educational in nature and not designed to be taken as advice or a recommendation for any specific investment product, strategy, plan feature or other purpose in any jurisdiction, nor is it a commitment from Directional Advisors to participate in any of the transactions mentioned herein. Any examples used are generic, hypothetical and for illustration purposes only. This material does not contain sufficient information to support an investment decision and it should not be relied upon by you in evaluating the merits of investing in any securities or products. In addition, users should make an independent assessment of the legal, regulatory, tax, credit, and accounting implications and determine, together with their own financial professionals, if any investment mentioned herein is believed to be appropriate to their personal goals. Investors should ensure that they obtain all available relevant information before making any investment. Any forecasts, figures, opinions or investment techniques and strategies set out are for information purposes only, based on certain assumptions and current market conditions and are subject to change without prior notice. All information presented herein is considered to be accurate at the time of production, but no warranty of accuracy is given and no liability in respect of any error or omission is accepted. It should be noted that investment involves risks, the value of investments and the income from them may fluctuate in accordance with market conditions and taxation agreements and investors may not get back the full amount invested. Both past performance and yields are not reliable indicators of current and future results.

What I Care About This Week | 2021 Apr 26

by Franklin J. Parker

The Summary

  • Durable goods orders post this week and we also get data on personal incomes for March. Those plus the home price data and initial unemployment claims posting will give us a read on the health of ongoing spending and whether that spending is translating into corporate expansion and investment. Home sales are beginning to be constrained by materials and this has started to push home prices higher. Housing is a component of so-called “core” inflation, so higher home prices translates into higher inflation.

  • We are now in the heart of earnings season. Of the companies that have reported so far, most have beat expectations, with the biggest upside surprises from Energy. Consumer staples (19% reported) have been disappointing with only 65% of companies delivering a beat. See the “Chart of the Week” for a breakdown.

  • The Bank of Canada has become the first central bank to signal the slowdown of quantitative easing. The BoC will reduce the current pace of government debt from C$4 billion to C$3 billion and expects to begin raising the benchmark interest rate in the second half of 2022. So far, the Federal Reserve and European Central Bank have avoided an end to QE, though many economists now expect the Federal Reserve to end, and begin to reverse (called “tapering”), the current program by the fourth quarter of this year. In my view, investors must be diligent on this data point as I see it likely to create some tumult in risk markets.

The Details

The big market-moving news last week was the Biden administration’s proposal to increase capital gains from 20% to just under 40% on people who earn $1 million or more in income. Risk markets sold off sharply, only to subsequently recover (probably on the realization that passage of such a proposal is unlikely).

While most investors will not be affected by this tax change directly, it does change the metrics and structure behind several types of investing. To illustrate the significance of the change, let us consider an example.

Suppose an investor subject to the higher capital gains rate is considering investing in a startup. In order to fund the project, she needs to sell some existing stock or, more likely, redirects the capital from the exit of a recent startup. If 95% of that capital is taxable as gains (not uncommon in venture capital), it would take almost five years to simply breakeven—and that assumes 15% growth per year! For comparison, under current capital gains rates, it takes about three years to recover the cash paid in taxes.

For public market growth projections (7% per year), the breakeven on switching investments goes to almost 9 years! Under the current rate it is in year four. In both venture capital and public markets, the increased capital gains rate almost doubles the breakeven rate of exiting and reinvesting those gains.

And that is before any additional taxes a state may levy.

In California, for example, the combined capital gains rate would be as high as 57%. Our breakeven for venture capital grows to an excess of 10 years (with a 15% growth rate), which is longer than the typical 7-10 year life of a fund!

Under these proposed capital gains, the incentive to our investor is to not exit their current venture. The incentive shifts to simply hold current investments longer. While on the face of it this seems like a good incentive, it has the effect of reducing capital available, specifically for startup companies.

As I’ve said before, our role as investors is not to opine about the merits or demerits of a policy proposal. Rather, we must adapt to new rules quickly and attempt to understand the effect new rules may have on both our existing and potential investments. Here are the knock-on effects I would expect should this tax increase come to pass.

First, we would likely see a change in the way venture capital funds are organized. Rather than a 7-10 year life cycle, we could see a shift toward 15-20 year funds. This has a secondary effect of slowing startup growth more broadly—a startup company that might take 10 years to compete its life cycle would take closer to 15 or 20. Recall, the most successful and prolific VC/PE funds are in California and New York, both high tax states. Their adaptation to new rules affects those of us in lower-tax states like Texas.

Second, this would likely create an incentive to hold real estate as it enjoys the advantage of the 1031 exchange and current income. A 1031 exchange allows an investor to roll a cost basis from one property to another—effectively deferring capital gains taxes. I would also expect an increase in the use of tax-deferred wrappers for risk capital, like custom annuity contracts or life insurance policies, a boon to insurance companies.

Third, capital flight from coastal states to central and southern is likely to increase as investors seek to lower their tax burden through geographical arbitrage. A well-heeled investor living in California who exits $10 million worth of startup companies per year would save around $1.2 million per year by moving to a no-income-tax state. Investors living in existing states could possibly get ahead of that flight by purchasing real estate of all kinds in the highly-trafficked areas.

Fourth, economic theory would suggest (and my own research backs this up) that lessened returns on investments that carry the same risk increases an individual’s propensity to spend today. Rather than merely accept lower returns, there will be increased incentive for wealthy people to spend their cash. Luxury goods providers could see a boost to their top line revenues.

Fifth, I would expect this policy proposal to create a headwind for market prices in the short term. Likely, investors would sell off assets to pay the current (lower) gains rate. While short-lived, it does provide an opportunity for patient investors to deploy cash (assuming the new cash isn’t an exchange from another investment in a taxable account).

All of that said, and though I am no political analyst, this proposal appears very unlikely to pass. With the Senate split 50-50, the Democrats cannot afford to lose a single vote from the moderates of their own party, and even representatives from California and New York are likely to mobilize in opposition. My estimation is that Biden is taking a page from Trump’s book: go big out of the gate, give away a lot in negotiation, and you end up where you wanted to be in the first place—a tax rate that is slightly higher, but not as dramatic as it first sounded.

I suggest investors sit tight for now and let the politicians do what they do.

Chart of the Week

Earnings season is in full swing. Apple and Caterpillar, both economic bellwethers, report on Wednesday. So far, earnings season has been quite strong. If tech and industrials can continue posting strong results, and we get a glimpse of the service economy staging a strong comeback, we may well grow in to the high valuations in stocks.

This document is a general communication being provided for informational purposes only. It is educational in nature and not designed to be taken as advice or a recommendation for any specific investment product, strategy, plan feature or other purpose in any jurisdiction, nor is it a commitment from Directional Advisors to participate in any of the transactions mentioned herein. Any examples used are generic, hypothetical and for illustration purposes only. This material does not contain sufficient information to support an investment decision and it should not be relied upon by you in evaluating the merits of investing in any securities or products. In addition, users should make an independent assessment of the legal, regulatory, tax, credit, and accounting implications and determine, together with their own financial professionals, if any investment mentioned herein is believed to be appropriate to their personal goals. Investors should ensure that they obtain all available relevant information before making any investment. Any forecasts, figures, opinions or investment techniques and strategies set out are for information purposes only, based on certain assumptions and current market conditions and are subject to change without prior notice. All information presented herein is considered to be accurate at the time of production, but no warranty of accuracy is given and no liability in respect of any error or omission is accepted. It should be noted that investment involves risks, the value of investments and the income from them may fluctuate in accordance with market conditions and taxation agreements and investors may not get back the full amount invested. Both past performance and yields are not reliable indicators of current and future results.

What I Care About This Week | 2021 April 19

by Franklin J. Parker, CFA

The Summary

  • Earnings! The major banks reported stellar earnings last week, though much of that came from trading in capital markets (IPO/bond issuance, market-making, etc). With interest rate spreads still narrow, banks have struggled to earn profits from traditional banking (taking deposits and lending money). At any rate, earnings season will be important as investors gauge the earnestness and momentum of the recovery in the real economy. Many big companies and consumer brands report this week, such as Coca-Cola, Proctor & Gamble, IBM, Netflix, and Chipotle.

  • Fundamental economic data last week was quite strong. Retail sales figures grew by 9.8% month-over-month, which far exceeded the 6% expected, and inflation posted almost exactly as expected at 2.6%. Weekly initial jobless claims fell by the most since the pandemic started, an encouraging sign for the labor market recovery.

  • This week is light on fundamental economic data (though earnings are important). The recovery in the real economy is going to test the market’s belief in the Federal Reserve’s patience—especially as asset prices continue to stretch already-lofty valuations. While the recovery is encouraging, the primary driver of this market is the Federal Reserve. News of “normalization”—while probably good long term—would be a short term headwind for market prices.

The Details

Photo by Worldspectrum on Pexels.com

Let’s talk about cryptocurrencies.

I remember listening to a Planet Money podcast on how crazy the Bitcoin market was going. The price had doubled, then tripled. People were making a fortune, only to lose it all shortly thereafter. There was talk of regulation, of banning Bitcoin outright, and how people had their coins stolen from their digital wallets.

That was in 2011.

Since I started following cryptocurrencies in 2011, not much has changed in the chatter surrounding them. Prices have changed, of course, and Bitcoin has a few competitors now (Dogecoin, Ethereum, etc), but the general sentiment remains the same: cryptocurrency is considered a real part of the digitized future, fortunes have been won and lost, and security remains a top concern for owners of these digital assets.

Before we talk about my take on them, let’s first talk about what they are.

Let’s say I want you to hear a song I like. In the olden days, for you to hear the song, I would have to bring you some form of physical media: a CD or a cassette tape, for example. If I wanted to hear that song again, I would need to get it back from you before I could again hear that song I like.

The point is, in the olden days, either you or I had the song at a given time, but we couldn’t both have it at the same time (unless we were together in the same place). Now, however, I can simply send you the song file: you would have the song and I would have the song at the same time. It isn’t magic, of course, we’ve simply made a digital copy of the file—I own a copy and you own a copy.

The technology that drives cryptocurrencies solves this problem of “uniqueness.” Using this underlying technology, I could actually send you a unique copy of the song I like. It is like an old school CD or cassette tape: if you have it, I can’t have it at the same time. Unlike a CD or cassette tape I don’t give you anything physical, the transaction is entirely digital.

An obvious application of this ability to create unique digital files is currency. By creating a limited number of unique digital “coins,” they can be exchanged just like a currency. They don’t exist outside of the digital world, of course, but because they are unique, they function the same! And because they are not tied to any monetary authority, there is no real friction to cross-border transactions, or the regulations that govern traditional dollar-based banking. It is, in that respect, similar to digital gold or silver.

I do believe that the technology driving cryptocurrencies is going to be an important piece of our future (it has lots of applications beyond cryptocurrencies). But—and this is a big ol’ “but”—that does not mean serious, long-term investors should load up on cryptocurrency.

First, the very thing that makes cryptocurrencies an exciting headline and an exciting investment is what makes them terrible currencies. Bitcoin, for example, lost 8.7% yesterday. That isn’t particularly newsworthy, though, because Bitcoin moves around quite a lot (it was up 8% on March 13th, for example). But, if you are running a sandwich shop and you want to accept Bitcoin as payment for your sandwiches, it is very difficult to accept the risk that the market price of Bitcoin wipes out all of your heard-earned profits in a day. The volatility of cryptocurrencies makes them awful currencies!

My second point is best expressed through an example. Let’s say that in the mid-1980s you knew cell phones would be a big thing in the future. There was only one company you could invest in: Motorola. Motorola, however, underperformed the broader market in the coming decade, and eventually went out of business altogether! You could never have guessed that the biggest winner in the cell phone revolution was a tiny computer company called Apple. Motorola in the 1980s teaches us an important lesson: just because we get the trend and technology right, doesn’t mean we know who will win or lose in the coming decades.

Finally, and most importantly: I have no clue how to value a cryptocurrency. Unlike other commodities, they have no intrinsic value. Unlike a traditional currency, they have no significant demand from industry or commerce. Unlike stock in a company, they produce no cashflows (in fact, you typically have to pay to store them). In the end, there are no real tools to analyze whether a cryptocurrency is overvalued or undervalued. It is this problem that has kept me on the sidelines.

It is at this point I can hear you thinking: “but Bitcoin has gone from $0 to $65,000 over the past decade.” And you are right. My assessment has been flat wrong for a decade.

Even so, my general advice for investing in cryptocurrencies is the same as it has always been: only invest money you can afford to lose. I see them as I always have, as a gamble.

Price of Bitcoin in US Dollars, 2015 to today.

Chart of the Week

I have, up to now, avoided talk of Covid on this blog. However, as the economic recovery gains steam, it is worth noting the trends in the pandemic. Though Asia and Australia have generally contained the virus, and North America has begun to stabilize our caseload, Europe and South America continue to struggle. New variants are a risk, of course, but with the large economies Europe resurging in recent weeks, the economic toll is again in focus.

In short, the economic recovery depends on the continued improvement in Covid cases, both in the US and around the world. Though I haven’t talked much about it, this is an important data point!

This document is a general communication being provided for informational purposes only. It is educational in nature and not designed to be taken as advice or a recommendation for any specific investment product, strategy, plan feature or other purpose in any jurisdiction, nor is it a commitment from Directional Advisors to participate in any of the transactions mentioned herein. Any examples used are generic, hypothetical and for illustration purposes only. This material does not contain sufficient information to support an investment decision and it should not be relied upon by you in evaluating the merits of investing in any securities or products. In addition, users should make an independent assessment of the legal, regulatory, tax, credit, and accounting implications and determine, together with their own financial professionals, if any investment mentioned herein is believed to be appropriate to their personal goals. Investors should ensure that they obtain all available relevant information before making any investment. Any forecasts, figures, opinions or investment techniques and strategies set out are for information purposes only, based on certain assumptions and current market conditions and are subject to change without prior notice. All information presented herein is considered to be accurate at the time of production, but no warranty of accuracy is given and no liability in respect of any error or omission is accepted. It should be noted that investment involves risks, the value of investments and the income from them may fluctuate in accordance with market conditions and taxation agreements and investors may not get back the full amount invested. Both past performance and yields are not reliable indicators of current and future results.

What I Care About This Week | 2021 Apr 12

by Franklin J. Parker, CFA

The Summary

  • On Tuesday, we get the latest read on inflation. Producer prices posted much higher than expected last week, though higher input costs have yet to be passed on to consumers. Food and energy have begun to run pretty hot, but the Fed likes to factor those out and look more closely at consumer goods. Even so, a headline inflation rate much higher than the expected 2.5% year-over-year would almost certainly push stock and bond prices down.

  • Retail sales also post this week (Thursday), with the consensus hovering around a 5.9% expansion (though some estimates are as high as 7%!). Consumer spending is a key variable to the ongoing economic recovery—fully 2/3rds of the US economy is just people buying stuff. The stimulus program in March and the effects of the extreme weather in February are expected to combine to produce solid growth figures in retail sales!

  • Biden has proposed a $2.3 trillion infrastructure package. Republicans have balked at the size of the deal, and even some moderate Democrats are expressing concern, both appear willing to consider a more targeted approach. That said, top Democrats seem more willing to move forward without bipartisan support. In either case, it is expected that a spending bill of this size would be mostly funded by newly-created money from the Federal Reserve. As with all monetary supply expansions, this has the side effect of driving up asset prices, and I expect this to be little different. Again, it is my view that so long as monetary policy is easy and the money supply is expanded, the bias in prices is up.

The Details & Chart of the Week

The ascension of China as the world’s economic superpower is so often talked about that the standard assumption is not if but when. It is easy to see why this is the standard assumption. Most economic growth models carry population and productivity as inputs, and with a population of 1.4 billion people, China need only slightly increase productivity to massively increase economic output.

Yet the not-so-often-talked-about addendum to this discussion is that, in the modern economy, not all economic output is created equal. The leaders of today’s economy do not compete just in manufacturing, but rather in information and technology. Today’s economic leadership is not defined by productivity on a factory floor.

In this week’s chart, Fathom Consulting illustrates the economic areas that China has both gained and lost ground over the past 15 years. These are not necessarily drawn from official figures, so they have sorted out some of the politically-biased reporting that we’ve come to expect from China’s official figures. What I find interesting is how China has held her own in several important fields—IT, New Energy, New Materials, and Medicine. She has lost substantial ground, however, in other key industries like Robotics, Aerospace, and Agriculture. Advanced Railway and Maritime Engineering are the only two places China has significantly increased her competitive advantage.

Said differently: it may well be that, through sheer numbers and ongoing productivity gains, China overtakes the US in economic output, but it is not raw output that matters. The type of output matters more than the absolute value of that output. South Korea is a perfect illustration of this fact. Though they are the 10th largest economy by output, they remain among the most important technological economies, ranking 1st on the International Innovation Index (China ranks 15th, and the US ranks 2nd). And remember, innovation is just a fancy word for an improving quality of life.

In the end, China has substantial ground to cover to gain a competitive advantage in the advanced modern economy. It isn’t enough to simply modernize or hold pace, since other countries continue to advance—she must advance more rapidly than other countries to gain true leadership of the global technological economy.

And even when China is the largest economy in the world, I find myself skeptical that this somehow dooms other countries to serfdom. Quality of life will continue to improve so long as innovation is central to our economic thinking.

This document is a general communication being provided for informational purposes only. It is educational in nature and not designed to be taken as advice or a recommendation for any specific investment product, strategy, plan feature or other purpose in any jurisdiction, nor is it a commitment from Directional Advisors to participate in any of the transactions mentioned herein. Any examples used are generic, hypothetical and for illustration purposes only. This material does not contain sufficient information to support an investment decision and it should not be relied upon by you in evaluating the merits of investing in any securities or products. In addition, users should make an independent assessment of the legal, regulatory, tax, credit, and accounting implications and determine, together with their own financial professionals, if any investment mentioned herein is believed to be appropriate to their personal goals. Investors should ensure that they obtain all available relevant information before making any investment. Any forecasts, figures, opinions or investment techniques and strategies set out are for information purposes only, based on certain assumptions and current market conditions and are subject to change without prior notice. All information presented herein is considered to be accurate at the time of production, but no warranty of accuracy is given and no liability in respect of any error or omission is accepted. It should be noted that investment involves risks, the value of investments and the income from them may fluctuate in accordance with market conditions and taxation agreements and investors may not get back the full amount invested. Both past performance and yields are not reliable indicators of current and future results.

What I Care About This Week | 2021 Apr 5

by Franklin J. Parker, CFA

The Summary

  • Investors appear to have renewed confidence in the economic recovery. Vaccination figures continue to rise, and Friday’s jobs report showing 911,000 jobs created in March blew past the expected 647,000. In total, the US economy has added 1.6 million jobs in the first quarter of 2021. At the current pace, all jobs lost through 2020 could be recouped by the end of the year.

  • Today, the Institute for Supply Management released their non-manufacturing activity index and it came in at a whopping 63.7, which is the highest reading in the history of the index. Given that the service sector is two-thirds of the US economy, this bodes well for the continued recovery. On Friday, we get data on producer prices. This is considered an important data point as it is typically the first read on inflation. Reuters polls suggest a 3.8% increase in producer prices over last year. A figure significantly higher than this could give markets pause.

  • Though I say it every week, it is worth repeating: the key variable in this market run is monetary and fiscal policy. The Fed’s current low interest rate and quantitative easing policy creates an upward bias in asset prices. Asset prices get a further boost from the deficit spending of the federal government which is financed by the Federal Reserve, of which Biden’s current ~$3 trillion infrastructure spending proposal is a good example. All of this cash finds its way into financial markets eventually, and it is currently fueling this bull run. The key variable to watch, then, is a shift in this policy.

The Details

Goals-based investing (GBI) has become a bit of a buzzword in finance. Unfortunately, like most buzzwords, most of the conversation around the topic is merely marketing.

But GBI is legitimately different from more traditional financial theory. Where traditional theory idealizes markets and investors, goals-based investing is concerned with how we can use financial markets to accomplish financial goals given real-world constraints.

Probably the most important difference between goals-based investing and traditional financial theory turns on the definition of “risk.” Traditionally, risk is defined as the amount of volatility (the up-and-downs) your portfolio is expected to suffer. Less portfolio risk, then, is less volatility. However, as you become less willing to accept volatility you also receive less return.

Goals-based investors, however, define risk as the probability of failing to achieve their goals. Portfolio volatility plays a role in that definition, of course, but so does return. The key, then, is to find the optimal balance between return and volatility that yields the highest probability of achieving your goals.

This redefinition of risk changes the conversation quite a bit. Cash, for example, has traditionally been considered the safest investment because it doesn’t change in value—it has no volatility. Goals-based investors, however, may well view cash as the riskiest asset class since, at times, it virtually guarantees the investor will not achieve her goals!

Investments, then, are simply tools to get various jobs done. To understand how to manage your investment portfolio, and to understand what risks you can afford to take, you must first understand the job you need doing. We cannot manage money in the abstract, as traditional theory may suggest.

Your investment portfolio must be fully defined by your objectives. If that is not the case, it wouldn’t hurt to open a conversation!

Chart of the Week

The prices producers pay (purple line in the chart below) usually moves with consumer prices (blue line in the chart below). This makes sense, of course, since manufacturers will tend to pass along their price increases to consumers. Consumer prices are the most widely followed measure of inflation, but the Fed generally prefers to look at “core” CPI, which factors out food and energy costs (black line).

For most people, however, food and energy costs are a substantial budget item. This is especially true for the poor who tend to spend a higher percentage of their incomes on food and a lower percentage on consumer goods. Recent food price inflation, then, should be a growing concern for policymakers as it is a cost borne disproportionately by the poor. Whereas consumer goods have benefited from disinflationary trends (like automation and off-shoring labor), commodities for which production cannot be so easily shifted (like food) have begun to see concerning levels of price increases—even after the Covid-induced supply constraints are factored out.

The recent surge in producer prices is also a concern, though the Fed has suggested that they expect it to be a transient effect. Polls of economists do seem to indicate a leveling off of producer price increases, but Friday’s figures will be very telling! Since inflation is the real constraint on current easy-money policy and ongoing deficit spending from Washington, these figures are getting considerably more attention than they used to.

This document is a general communication being provided for informational purposes only. It is educational in nature and not designed to be taken as advice or a recommendation for any specific investment product, strategy, plan feature or other purpose in any jurisdiction, nor is it a commitment from Directional Advisors to participate in any of the transactions mentioned herein. Any examples used are generic, hypothetical and for illustration purposes only. This material does not contain sufficient information to support an investment decision and it should not be relied upon by you in evaluating the merits of investing in any securities or products. In addition, users should make an independent assessment of the legal, regulatory, tax, credit, and accounting implications and determine, together with their own financial professionals, if any investment mentioned herein is believed to be appropriate to their personal goals. Investors should ensure that they obtain all available relevant information before making any investment. Any forecasts, figures, opinions or investment techniques and strategies set out are for information purposes only, based on certain assumptions and current market conditions and are subject to change without prior notice. All information presented herein is considered to be accurate at the time of production, but no warranty of accuracy is given and no liability in respect of any error or omission is accepted. It should be noted that investment involves risks, the value of investments and the income from them may fluctuate in accordance with market conditions and taxation agreements and investors may not get back the full amount invested. Both past performance and yields are not reliable indicators of current and future results.

What I Care About This Week | 2021 Mar 29

by Franklin J. Parker, CFA

The Summary

  • Markets were rattled on Friday (and Monday) by what appears to be the largest margin call ever. Bloomberg reports that the family office of Bill Hwang—a controversial Wall Street figure who previously pled guilty to insider trading—was behind the selling. Many stocks were effected, including the banks who lent Hwang the money, and traders are not sure if the sudden selling is over or if this could create systemic issues, yielding some nervousness in prices this morning.

  • The Fed again reiterated its commitment to current policy. In a flurry of speeches last week, Fed officials basically said the same things they have been saying—they are going to wait until the actual economic data improves before normalizing policy. In a similar vein, the Biden administration is expected to reveal a $3 trillion infrastructure spending package, though quick passage seems unlikely.

  • We get March jobs data on Friday, and consumer confidence tomorrow. The jobs data will be important because it is an indicator for Fed policy, and since consumer spending has waned recently a boost in consumer confidence could help bolster prices. Again: so long long as the Fed continues their current policy, our view is that the bias in prices is up.

The Details

Almost every economic growth model carries population growth as an input. All else equal, growth in population tends to fuel growth in the economy. Economists, then, spend quite a bit of time attempting to forecast how much the population will grow in the coming years.

As The Economist recently reported, Covid appears to have slowed the birth rates in developed countries, contrary to some predictions. The US and China, for example, saw a 15% decline in births in 2020. Of course, most developed countries have long had native birth rates well below the 2.1 children per woman required to maintain their population, so Covid has simply compounded a problem that has been in the works for some time: peak population. With the recent global deaths from Covid and the reduced birth rate, it appears the human population is now likely to peak and then begin declining sometime around 2050—about a decade sooner than previously expected.

And it isn’t the absence of labor force growth that is of most concern, that effect is likely to be offset by automation. It is the decline of innovation that carries the largest economic consequence. With fewer minds to solve problems, fewer problems will be solved. Standards of living could then begin to slow and reverse. If global fertility rates stabilize below the required 2.1 children per woman, mankind will have to learn to deal with a new problem: getting economic growth from an ever-smaller population.

There have been, of course, no shortage of doomsayers through the years proclaiming the coming decline of humanity. What those doomsayers repeatedly fail to remember is the power of unbridled innovation. Just when economists were predicting great famines across Europe due to lack of food, Fritz Haber invented a way to capture nitrogen from the air and make fertilizer. Crop yields massively increased and the famines were averted. Just when England had felled all her forests in support of the “great wooden wall” that was her navy, shipbuilders turned to steel and built inconceivably powerful ships.

In the end, I tend to believe in the plucky and inventive nature of mankind. We tend to solve problems, and I think this will be no different. Even so, population growth has slowed in recent years. One lesson that Japan has given us in recent decades is the drag on economic growth that ageing and shrinking populations can create in modern economies. While this is, in many ways, “tomorrow’s problem,” it is a large-scale force that we must consider as investors.

Chart of the Week

Despite all the market drama of the past month or so, the main stock market index, the S&P 500, was only down 5.8% peak-to-trough. After rallying back off of its low, it pulled back a mere 3.4% in the most recent two weeks. It is important to put these recent market moves in perspective, because once we do, it becomes clear that this is all pretty normal and shouldn’t be concerning to long-term investors.

This document is a general communication being provided for informational purposes only. It is educational in nature and not designed to be taken as advice or a recommendation for any specific investment product, strategy, plan feature or other purpose in any jurisdiction, nor is it a commitment from Directional Advisors to participate in any of the transactions mentioned herein. Any examples used are generic, hypothetical and for illustration purposes only. This material does not contain sufficient information to support an investment decision and it should not be relied upon by you in evaluating the merits of investing in any securities or products. In addition, users should make an independent assessment of the legal, regulatory, tax, credit, and accounting implications and determine, together with their own financial professionals, if any investment mentioned herein is believed to be appropriate to their personal goals. Investors should ensure that they obtain all available relevant information before making any investment. Any forecasts, figures, opinions or investment techniques and strategies set out are for information purposes only, based on certain assumptions and current market conditions and are subject to change without prior notice. All information presented herein is considered to be accurate at the time of production, but no warranty of accuracy is given and no liability in respect of any error or omission is accepted. It should be noted that investment involves risks, the value of investments and the income from them may fluctuate in accordance with market conditions and taxation agreements and investors may not get back the full amount invested. Both past performance and yields are not reliable indicators of current and future results.