What I Care About This Week | 2022 Nov 14

by Franklin J. Parker, CFA

The Summary

  • The Bottom Line. With slightly lower inflation, investors caught hope that the Fed will slow rate hikes. Earnings are meh, but certainly not recessionary, and this week we get some important data on the fundamentals of the economy. I could see this as the beginning of a meaningful recovery rally. However, I would temper any enthusiasm with the longer-term outlook, which appears tepid at best.

  • The big news last week was a lower-than-expected inflation print (7.7% versus 8.0% expected). This lent investors hope that the Fed will slow down their rate increases. Earnings are mostly finished with over 90% of S&P 500 having reported. Earnings growth across all sectors is just over 2% for the quarter, which is not great but not terrible. With revenues up over 10% (and earnings up only 2%), investors are seeing inflation take its bite.

  • This week we get data on industrial production, retail sales, and producer prices (a measure of inflation). Each of these are important for insight on the economy. Investors will also listen to management outlooks from retail bellwethers Target and Walmart, especially with the Christmas shopping season rapidly approaching. Consumer spending has remained strong and has lifted the economy, but a slowdown in this would be bearish.

The Details

“It’s only when the tide goes out that you learn who has been swimming naked.”

Warren Buffett

Well… crypto markets have imploded over the past couple of weeks.

After sudden price plunges, one of the largest cryptocurrency exchanges, FTX, went suddenly and dramatically insolvent. Reuters reported that $1 billion to $2 billion was missing from client accounts and, apparently, executives at the exchange had surreptitiously moved about $10 billion to their trading firm to fund risky bets on other crypto businesses and market trades.

First of all, this has all happened before, which is why investors should be students of history as much as of markets. In the 1920s, banks and brokerage houses regularly used client money to fund risky market bets. It turns out this strategy still doesn’t work, but it is good to be reminded of that every century or so.

Second, it was amidst the fallout of those trades in the 1920s that lawmakers formed the FDIC, SEC, and the now-famous Securities Acts of 1933 and 1934, all of which still govern financial businesses and transactions. Crypto markets, of course, haven’t had such regulatory oversight and law, but I strongly suspect this is about to change.

Finally, crypto’s meltdown is a stark reminder of the difference between professionals and amateurs. Amateurs are obsessed with making money. Professionals are obsessed with managing risk. This event is likely to wash amateurs out of the business, making room for professionals to step in.

In the end, I see crypto laws and regulation coming quickly (politicians have already started making some noise about this), and I would expect a more professional class to begin managing these financial businesses. Both of these represent a real maturation of the sector and are very healthy, long-term.

Crypto isn’t dead, in my view, it is just growing up.

Chart of the Week

This week’s chart comes to us from Bloomberg News, and is notable for its historicity. The founder of the exchange FTX, Sam Bankman-Fried’s change in net worth may well be the fastest in the history of mankind—going from $16 billion to $0 in the space of about 36 hours.

This document is a general communication being provided for informational purposes only. It is educational in nature and not designed to be taken as advice or a recommendation for any specific investment product, strategy, plan feature or other purpose in any jurisdiction, nor is it a commitment from Directional Advisors to participate in any of the transactions mentioned herein. Any examples used are generic, hypothetical and for illustration purposes only. This material does not contain sufficient information to support an investment decision and it should not be relied upon by you in evaluating the merits of investing in any securities or products. In addition, users should make an independent assessment of the legal, regulatory, tax, credit, and accounting implications and determine, together with their own financial professionals, if any investment mentioned herein is believed to be appropriate to their personal goals. Investors should ensure that they obtain all available relevant information before making any investment. Any forecasts, figures, opinions or investment techniques and strategies set out are for information purposes only, based on certain assumptions and current market conditions and are subject to change without prior notice. All information presented herein is considered to be accurate at the time of production, but no warranty of accuracy is given and no liability in respect of any error or omission is accepted. It should be noted that investment involves risks, the value of investments and the income from them may fluctuate in accordance with market conditions and taxation agreements and investors may not get back the full amount invested. Both past performance and yields are not reliable indicators of current and future results.

What I Care About This Week | 2022 Nov 7

by Franklin J. Parker, CFA

The Summary

  • The Bottom Line. With the Fed maintaining its aggressive posture, investors are forced to continue bidding down company valuations. This is likely to put the P/E ratio for public (and private) companies under continued pressure. This, all while inflation takes its bite from corporate profits. Despite all of this, demand remains strong and the labor market remains tight. Until the fundamentals of the economy start to erode in a meaningful way, investors may do well to simply sit tight and let this transition develop.

  • Earnings reports were largely sidelined in the news last week, overshadowed by the Fed and other big economic data. As it stands, 85% of S&P 500 companies have reported results, and it appears that earnings will be about 2.2% higher than they were at this time last year. Overall, this shows that earnings are beginning to wane in a meaningful way, and analysts now expect negative earnings growth in Q4 of this year (-1%). There is probably no more illustrative point about the damaging power of inflation on corporate profits than seeing revenues up by 10% and profits down 1%.

  • Last week saw considerable data, but none more important than the Fed’s interest rate hike and press conference. The Fed firmly declined to pivot, and seemed to warn investors that rates will keep going up, and may stay at higher levels for some time. Of course, markets sold away the hope of that dovish change in expectation of an aggressive Fed.

  • This week, we see the all-important inflation figure (8%, year-over-year is expected), and we also get consumer sentiment data. Of course, the US midterm elections are also this week (though market reaction is expected to be muted). Consumer credit posted today with a slight decline (down $5 billion, which was a pleasant surprise). Overall, this week is much quieter on the data front than last.

The Details

One thing that really struck me at the Fed’s press conference last week were several questions from reporters on how the Fed knows when rates are just right. In other words: what does the Fed believe causes or halts inflation? Understanding the Fed’s model helps investors understand how to interpret the data through the Fed’s lens.

And this is a topic that has been rather hot lately, especially in the political sphere (there is an election tomorrow, after all). And it is an important question: what causes inflation?

Sen. Elizabeth Warren has suggested that inflation is the result of higher energy costs from the war in Ukraine, and even corporate greed. Sen. Mitch McConnell has blamed excessive spending. Others have blamed bottlenecked supply chains.

Discerning the cause(s) of inflation is important because different causes call for different solutions and different tools.

Economists, generally, have three formal models of inflation of which I am aware:

  • Inflation is always and everywhere a monetary phenomenon. This was Nobel-laureate Milton Friedman’s view. He believed that central banks are the sole responsible parties for inflation. Creating currency from nothing debases your currency. Therefore, inflation is a monetary policy issue.
  • Inflation is the result of deficit spending on things that do not create economic growth. This is a much more recent view, one espoused by what is generally called Modern Monetary Theory. In short, creating currency from nothing is not necessarily bad, so long as it is spent on productive projects. It is inflationary when those projects are not productive.
  • Inflation is the result of the interplay between monetary policy, government spending, taxes, and economic growth. This is known as the Fiscal Theory of Price Level. Inflation is the result people losing faith in a government’s ability to repay its debts.

Each, of course, carries its own recommended solutions (and models). What became clear to me last week, however, is that the Fed does not subscribe to any particular view or model. In short, the Fed seems to believe that inflation exists, they have tools, so they’ll use them until they work.

And so we wait for them to work.

Chart of the Week

This week’s chart is a look at household savings rates in the US, UK, and Eurozone. The Covid stimulus across these areas is clearly seen as the spike on the chart. However, individuals in each economic zone have not responded the same over the past couple of years. The Eurozone and UK have both maintained higher savings rates than before the pandemic (and saw less of a spike). The US, by contrast, has seen savings rates plummet to 20-year lows, only lower in 2005.

In short, while people are still saving, it is clear that current spending in the US is coming from money that would have been saved in the previous economic cycle. While this is keeping consumer demand up, there is a limit. At some point consumers are forced to slow down and again resort to saving.

This document is a general communication being provided for informational purposes only. It is educational in nature and not designed to be taken as advice or a recommendation for any specific investment product, strategy, plan feature or other purpose in any jurisdiction, nor is it a commitment from Directional Advisors to participate in any of the transactions mentioned herein. Any examples used are generic, hypothetical and for illustration purposes only. This material does not contain sufficient information to support an investment decision and it should not be relied upon by you in evaluating the merits of investing in any securities or products. In addition, users should make an independent assessment of the legal, regulatory, tax, credit, and accounting implications and determine, together with their own financial professionals, if any investment mentioned herein is believed to be appropriate to their personal goals. Investors should ensure that they obtain all available relevant information before making any investment. Any forecasts, figures, opinions or investment techniques and strategies set out are for information purposes only, based on certain assumptions and current market conditions and are subject to change without prior notice. All information presented herein is considered to be accurate at the time of production, but no warranty of accuracy is given and no liability in respect of any error or omission is accepted. It should be noted that investment involves risks, the value of investments and the income from them may fluctuate in accordance with market conditions and taxation agreements and investors may not get back the full amount invested. Both past performance and yields are not reliable indicators of current and future results.

What I Care About This Week | 2022 Oct 31

by Franklin J. Parker, CFA

The Summary

  • The Bottom Line. Last week’s GDP print was encouraging, and may have struck the right balance: economic growth, but with flagging consumer and business spending. The Fed meets this week, and all ears are listening for whether they plan to adjust the path of interest rate hikes. If we get some dovish commentary (which is my expectation), we could then expect to see a market rally. Overall, my view is cautious, but not pessimistic. There are some buying opportunities in this market, in my view, but consumer spending will be a key variable to watch.

  • In addition to being Fed week, investors get lots of data. We see data on manufacturing, job openings, the unemployment rate, productivity, and consumer credit. Any of this data could move markets, but it will be the Fed meeting that will dominate both the news and market gyrations.

  • Grains and foodstuffs are back in the news as Russia has pulled out of a pact to continue grain exports citing danger to merchant shipping. This in addition to rising energy prices, globally. In addition to the humanitarian concerns, food and energy are basic inputs into economies. With higher energy and food costs, economic growth is expected to slow in addition to the upward pressure this puts on already-high inflation figures.

The Details

This week we’re going to discuss a pet peeve of mine.

It is not uncommon to see charts like the one below both online and in presentations. The narrative usually runs something like this: markets have grown exponentially, and, over time, long-term investors are rewarded by simply staying invested. So, the conclusion runs, you should just stay invested!

What irks me about this narrative is that it is both true and not true.

It is true in the factual sense: yes, over a 60-year period, markets have tended to deliver exponential returns (see chart below), and there is a reasonable basis to believe the next 60-years will look similarly.

It is untrue in the sense that almost no one has a 60-year time horizon!

Real people who have real goals to achieve will become short-term investors at some point, which, unfortunately, makes all of us market timers. It is not enough to simply say “don’t worry, it’ll come back!” Of course markets will come back, but that isn’t the relevant concern. Whether markets recover in time for you to accomplish your goals is the relevant concern.

Proper investment and risk management must begin with an understanding of your goals. For some objectives, you may have a 30-year time horizon, while you may have a 3-year time horizon for others. Managing risk looks entirely different in each of those accounts.

Chart of the Week

Last week’s GDP release was both encouraging and discouraging.

Headline GDP growth was better than expected at 2.6%. However, private investment continued to contract and consumer spending, though still positive, was less than expected. In short, exports boosted GDP growth much more than normal, but that is unlikely to continue much longer.

The key variables to watch, in my view, are consumer spending (personal consumption, in the chart below) and private investment. If we see both of those turning negative, a recession is likely not far behind.

This document is a general communication being provided for informational purposes only. It is educational in nature and not designed to be taken as advice or a recommendation for any specific investment product, strategy, plan feature or other purpose in any jurisdiction, nor is it a commitment from Directional Advisors to participate in any of the transactions mentioned herein. Any examples used are generic, hypothetical and for illustration purposes only. This material does not contain sufficient information to support an investment decision and it should not be relied upon by you in evaluating the merits of investing in any securities or products. In addition, users should make an independent assessment of the legal, regulatory, tax, credit, and accounting implications and determine, together with their own financial professionals, if any investment mentioned herein is believed to be appropriate to their personal goals. Investors should ensure that they obtain all available relevant information before making any investment. Any forecasts, figures, opinions or investment techniques and strategies set out are for information purposes only, based on certain assumptions and current market conditions and are subject to change without prior notice. All information presented herein is considered to be accurate at the time of production, but no warranty of accuracy is given and no liability in respect of any error or omission is accepted. It should be noted that investment involves risks, the value of investments and the income from them may fluctuate in accordance with market conditions and taxation agreements and investors may not get back the full amount invested. Both past performance and yields are not reliable indicators of current and future results.

What I Care About This Week | 2022 Oct 24

by Franklin J. Parker, CFA

The Summary

  • The Bottom Line. It is my view that investors could see an upside surprise from the Fed next week. While markets have priced-in a 0.75% rate hike (which I think is likely), I believe the central bank is also likely to offer more dovish guidance on the path of future hikes. Furthermore, the economy has remained fairly robust to these hikes and earnings growth is likely to continue through the end of the year. I would caution investors against being overly pessimistic at this moment.

  • About 20% of the S&P 500 has reported earnings for Q3, and it looks like companies will report around 3% profit growth over last year. Profit margins have started to show signs of pressure as companies are having more difficulty passing along cost increases from inflation. 3% profit growth is not great, but it is also not recessionary, and analysts continue to expect profit growth through year-end.

  • This week is a pretty busy one for data. Global PMI’s posted today—offering some insight into the health of global manufacturing and services—both posted a slight decline. Consumer confidence and new home sales both post this week, as do durable goods orders, and an advance reading on Q3 GDP. We also get personal consumption expenditures, which is the Fed’s preferred measure of inflation. Since the Fed meeting is next week, investors will be interpreting this data through the lens of Fed actions—which means that bad news is good news.

The Details

In my upcoming book, I recount a story from early in my career. The firm I was with rolled out some new financial planning software. Responding to my question, the trainer indicated that I could just put in long-run averages for my inflation assumptions, that “it really doesn’t matter too much anyway.” As I played around with the tool, however, I found that this was flat wrong—inflation assumptions mattered quite a lot!

Indeed, over the course of 20 years, the difference between a 3% inflation rate and a 5% inflation rate is the difference between achieving your goal and having only about two-thirds of the money you need! Said another way: you need almost 50% more money in the 5% inflationary scenario than in the 3% inflationary scenario.

The details of this are covered in my book, so I won’t recount them here. The point is, the damage done by high inflation cannot be understated. Furthermore, getting assumptions like this as right as possible when running financial planning scenarios is critically important. It is not enough to say “yeah, 3% is close enough.” Time and effort spent getting those expectations as right as possible is time and effort well spent!

So, while investors are rightfully reeling at the recent market selloff, inflation does considerably more damage, long-term, than do these short-term market downswings. Getting inflation back down is critical for investors with goals to achieve. And it is especially important for investors and practitioners who underestimated inflation over the coming decade.

Chart of the Week

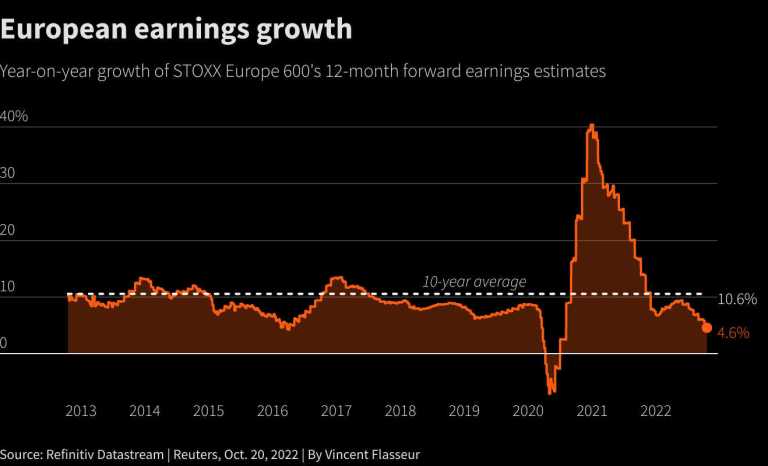
There is a strange dichotomy in markets at the moment. On the one hand, talk of a recession is everywhere. On the other hand, analysts don’t see a recession in their earnings forecasts. European earnings estimates 1-year ahead of now indicate expectations for almost 5% earnings growth. Certainly not great, but also not recessionary. We see something similar in the US earnings growth outlook. Analysts expect mid to low single-digit earnings growth through next year. Again, not great, but not recessionary.

It can be easy to get caught up in a narrative. As investors, we should always let the data drive our narrative. At the moment, the data does not indicate that fear is warranted. Caution, certainly, but recessionary fears may be overblown—at least for the moment.

Of course, as the data changes, so do our minds.

This document is a general communication being provided for informational purposes only. It is educational in nature and not designed to be taken as advice or a recommendation for any specific investment product, strategy, plan feature or other purpose in any jurisdiction, nor is it a commitment from Directional Advisors to participate in any of the transactions mentioned herein. Any examples used are generic, hypothetical and for illustration purposes only. This material does not contain sufficient information to support an investment decision and it should not be relied upon by you in evaluating the merits of investing in any securities or products. In addition, users should make an independent assessment of the legal, regulatory, tax, credit, and accounting implications and determine, together with their own financial professionals, if any investment mentioned herein is believed to be appropriate to their personal goals. Investors should ensure that they obtain all available relevant information before making any investment. Any forecasts, figures, opinions or investment techniques and strategies set out are for information purposes only, based on certain assumptions and current market conditions and are subject to change without prior notice. All information presented herein is considered to be accurate at the time of production, but no warranty of accuracy is given and no liability in respect of any error or omission is accepted. It should be noted that investment involves risks, the value of investments and the income from them may fluctuate in accordance with market conditions and taxation agreements and investors may not get back the full amount invested. Both past performance and yields are not reliable indicators of current and future results.

What I Care About This Week | 2022 Oct 10

by Franklin J. Parker, CFA

The Summary

  • The Bottom Line. This week starts earnings season, which will be important, but not nearly as important as the ongoing economic data as interpreted through Federal Reserve’s actions. In sum, investors expect about 3% earnings growth for this quarter, and outlooks will be watched closely for signs that inflation is eating into profits and/or consumers have slowed their buying.

  • Major banks, Walgreens, and Delta Airlines report earnings this week. Investors are listening closely to calls with executives to hear their outlooks for the economy, inflation, and spending. In sum, earnings are expected to grow about 3% for the quarter, but that is not equally distributed. Energy, Industrials, and Consumer Discretionary sectors are expected to see the highest growth this quarter, whereas Telecom, Financials, and Materials are expected to see the biggest drop.

    We also see data on inflation, retail sales, and consumer sentiment this week. Inflation is expected to post around 8.1%. Lower inflation would likely boost markets, whereas higher inflation would likely see markets sell off again.

  • Last week’s unemployment rate was generally positive: a drop from 3.6% to 3.5%, and more jobs than expected were created. This sent markets into a tailspin as investors moved away from a “the Fed is almost done” attitude toward a “the Fed is going to keep hiking rates.” As I have mentioned before, the underlying economy has remained fairly robust to the Fed’s actions so far. In my view, it is ultimately the economic data and corporate profits which drive prices.

The Details

I have tried to avoid it, but we have to talk about the war in Ukraine.

Of course, most people are rooting for Ukraine to prevail. However, exactly what the response of Europe and the United States should be to Putin’s aggressive invasion of his neighbor has become a politically-charged topic. It is not my intent to weigh in on the politics of the conflict, rather, I want to consider some high-level risks facing investors from the ongoing conflict.

First, as we have seen, the conflict has exacerbated inflation. Energy costs have ballooned, and grain costs have also jumped considerably. We have also seen many large companies work to divest their Russia-based holdings, partly in response to sanctions, but partly as a show of solidarity with Ukraine.

There is a deeper risk, however. Ukraine has become a proxy war between the US, her allies, and Russia. Which brings back many cold war era geopolitical risks. World War I showed us that regional proxy wars can ignite wider and more damaging confrontations, for example. Those wider confrontations change the nature of economies and therefore the investment landscape—especially when the largest economies in the world are involved.

From a consequence perspective (though not a probability perspective), the biggest risk is that nuclear-armed states are pulled into a hot war with one another. Since the dawn of the nuclear age, a direct war between nuclear-armed states has been avoided (because no one is sure how it would end), but past behavior is no guarantee of future results. And this risk, while unlikely, seems worth paying a high price to hedge away because the consequences are so large.

As this war becomes drawn out, these geopolitical risks grow. Investors should be mindful of the role they play in their portfolio allocation and risk-management. Again, I see these risks as small, and I do not claim the sky is falling. However, it would be equally foolish to claim that all is well on the eastern front.

Chart of the Week

This week’s chart is very simple: it shows the percentage of revenue earned internationally and domestically by companies in the S&P 500. What becomes obvious is that the 500 largest US companies are quite geographically diversified, which is both good and bad.

The good side means that these companies continue to expand into new markets, and that a blip in one area of the world has less of an impact on the overall movement of S&P 500 prices.

On the bad side: as the US dollar grows stronger relative to other currencies, the revenues coming from those international holdings becomes worth less when converted back to the US dollar. There are some tricks for offsetting that risk, but, ultimately, currency risks are something that companies just have to bear.

With the dollar growing stronger, existing international holdings become more of a drag on performance for US-based investors. For non-US-based investors, this exchange-rate move makes US markets considerably more attractive than they have been in a while.

source: FactSet Research Systems

This document is a general communication being provided for informational purposes only. It is educational in nature and not designed to be taken as advice or a recommendation for any specific investment product, strategy, plan feature or other purpose in any jurisdiction, nor is it a commitment from Directional Advisors to participate in any of the transactions mentioned herein. Any examples used are generic, hypothetical and for illustration purposes only. This material does not contain sufficient information to support an investment decision and it should not be relied upon by you in evaluating the merits of investing in any securities or products. In addition, users should make an independent assessment of the legal, regulatory, tax, credit, and accounting implications and determine, together with their own financial professionals, if any investment mentioned herein is believed to be appropriate to their personal goals. Investors should ensure that they obtain all available relevant information before making any investment. Any forecasts, figures, opinions or investment techniques and strategies set out are for information purposes only, based on certain assumptions and current market conditions and are subject to change without prior notice. All information presented herein is considered to be accurate at the time of production, but no warranty of accuracy is given and no liability in respect of any error or omission is accepted. It should be noted that investment involves risks, the value of investments and the income from them may fluctuate in accordance with market conditions and taxation agreements and investors may not get back the full amount invested. Both past performance and yields are not reliable indicators of current and future results.

What I Care About This Week | 2022 Oct 3

by Franklin J. Parker, CFA

The Summary

  • The Bottom Line. Despite the Fed’s best efforts to slow it down, the US economy remains ok, though Q3 earnings in a couple of weeks will be an important data point. Bonds are starting to look like good investments again, so some of the recent selloff may be investors moving back down the risk spectrum and picking up some yield, a reversal of the trend we have seen over the last decade where cash has flowed into ever-riskier assets. Unless consumer and business spending slow, or corporate earnings deteriorate in a meaningful way, it is my view that there is a bottom in these markets somewhere near here.

  • This week we see data on jobs for September and factory orders for July, both important. Despite the Fed’s efforts to slow it down, the job market remains very tight, which is fueling demand in the economy. We expect factory orders to shrink, and we expect an addition of about 250,000 jobs with an unemployment rate holding steady at 3.7%. Ironically, if this data comes in better than expected, it will push the Fed to be more aggressive in their rate hikes, so we are in a good-news-is-bad-news situation here.

  • Last week’s data was a continuation of the trend. Consumer confidence surprised to the upside and weekly jobless claims were fewer than expected, while durable goods orders shrank. Consumer spending is a key variable to watch in the coming quarter.

The Details

Let’s talk about the constraints on central banks.

Over the past week or so, the UK has seen enormous moves in its bond market and currency market. At a time when the Bank of England (the UK’s central bank, also called the BOE) has said they want to stop printing money and buying government bonds, the new prime minister proposed a significant tax cut. Obviously, when a government has less revenue and more expenses, someone has to finance that deficit by lending them money.

Over the past decade or so, the Bank of England has been fine with creating money and lending it to the UK government. With that program coming to an end, it is investors who are left to lend their money to the UK government to cover deficits. However, unlike central banks, investors care about getting paid back.

With the rate on UK government debt suddenly out of the hands of the BOE and in the hands of investors, the gap between what investors demand to be paid and what the central bank demands to be paid became immediately and painfully obvious.

In the end, the BOE stepped into the market and said they would start buying bonds to stabilize the market, which can be read as “to keep borrowing rates for parliament at reasonable levels.”

This is a bit of a lesson for central banks, globally. There are very real constraints on what central banks can do (and I have talked about this before), not the least of which is political. If the pain becomes too great, central bank heads (who are themselves political appointees) will be replaced. I expect central bankers know this, and are doing what they can quickly before those constraints are reached and/or noticed.

This is a slightly different view than most of the marketplace which seems to believe that central banks can operate as unconstrained as they wish.

Chart of the Week

There is an interesting relationship between earnings yield on stocks (which is the inverse of the price-to-earnings ratio), and 10-year US Treasury yields. In essence, investors have a choice between getting yield through stocks or getting yields through bonds. When bond yields fall, earnings yields tend to fall, as well. This means that stock valuations get higher.

Now that bond yields are marching upward in a meaningful way, valuations are coming back down. After seeing the gap between the two widen to historically high levels, it is now moving to be more normalized. Moreover, there are times when earnings yields are lower than bond yields, but those tend to be outliers (1980s and 1990s, or in recessions), but it is possible if we see a return to a stagflationary environment.

This document is a general communication being provided for informational purposes only. It is educational in nature and not designed to be taken as advice or a recommendation for any specific investment product, strategy, plan feature or other purpose in any jurisdiction, nor is it a commitment from Directional Advisors to participate in any of the transactions mentioned herein. Any examples used are generic, hypothetical and for illustration purposes only. This material does not contain sufficient information to support an investment decision and it should not be relied upon by you in evaluating the merits of investing in any securities or products. In addition, users should make an independent assessment of the legal, regulatory, tax, credit, and accounting implications and determine, together with their own financial professionals, if any investment mentioned herein is believed to be appropriate to their personal goals. Investors should ensure that they obtain all available relevant information before making any investment. Any forecasts, figures, opinions or investment techniques and strategies set out are for information purposes only, based on certain assumptions and current market conditions and are subject to change without prior notice. All information presented herein is considered to be accurate at the time of production, but no warranty of accuracy is given and no liability in respect of any error or omission is accepted. It should be noted that investment involves risks, the value of investments and the income from them may fluctuate in accordance with market conditions and taxation agreements and investors may not get back the full amount invested. Both past performance and yields are not reliable indicators of current and future results.
What I Care About This Week | 2022 Sep 19

by Franklin J. Parker, CFA

The Summary

  • The Bottom Line. The Federal Reserve meets this week. Markets expect a 0.75% rate hike, but it will be the chairman’s commentary and Q&A that is likely to push prices around the most. As I have said many times before, the key variables to watch are economic demand (consumer and business spending). If demand falters, a recession is likely not far behind. Until then, however, I expect modest expansion in profits and prices, though volatility is likely to remain elevated.

  • Last week’s higher-than-expected 8.3% inflation figure caught many investors flat-footed. Producer prices (which is the inflation that businesses feel), also increased more than expected. That said, retail sales were better than expected, a sign that demand is still strong—an interpretation furthered by the University of Michigan’s Consumer Sentiment indicator, which ticked up over last month.

  • This week is all about the Fed on Wednesday. We also get some insight into housing starts and existing home sales—both of which are important points as rates have shot up over the past months.

The Details

What is Risk?

There is a disconnect between how the financial industry defines risk and how individuals define risk.

Traditionally, risk is the volatility of your portfolio—the roller-coaster ride of ups and downs. When financial professionals discus risk, this is the definition they are using. By contrast, if you asked 100 individual investors to define risk I would expect that 95 of them would say risk is losing money.

But why is “losing money” our intuitive definition of risk? I think this is because we invest with some purpose in mind, with a goal we are trying to achieve. Losing money lowers the probability that we can achieve our goals, so, to our intuition, losing money is risk.

In the context of achieving goals, however, it would seem that risk, really, is the probability of failure, not losing money, per se.

And this is an important observation: your goals will define what is risky.

For goals that must be achieved within the next few years, a significant market loss is a big risk (because markets take time to recover). However, for goals that are 10+ years away, the bigger risk is staying in cash and missing 10+ years of market growth.

Contextualizing risk is a very very important component of proper investment management. It will dictate how we react to given market events and, just like everything else in investing, there is no one-size-fits-all solution!

For anyone interested in a deeper dive, redefining risk is a topic in my upcoming book Goals-Based Portfolio Theory. Adjusting our thinking really does adjust the portfolio management strategy, and that is also something we implement at Directional Advisors. As always, we’d welcome a conversation with you.

Chart of the Week

The main leverage Russia has over Europe is its natural gas. Many European countries, especially the industrial giant Germany, rely on Russian imports of natural gas. After beginning the year with natural gas storage well below the 2017-2021 average, European countries have caught up and have begun to surpass their 2017-2022 storage levels of natural gas.

Despite the aggressiveness of storage, Europeans are likely to see considerable pain in energy prices this winter.

source: Reuters / Refinitiv

This document is a general communication being provided for informational purposes only. It is educational in nature and not designed to be taken as advice or a recommendation for any specific investment product, strategy, plan feature or other purpose in any jurisdiction, nor is it a commitment from Directional Advisors to participate in any of the transactions mentioned herein. Any examples used are generic, hypothetical and for illustration purposes only. This material does not contain sufficient information to support an investment decision and it should not be relied upon by you in evaluating the merits of investing in any securities or products. In addition, users should make an independent assessment of the legal, regulatory, tax, credit, and accounting implications and determine, together with their own financial professionals, if any investment mentioned herein is believed to be appropriate to their personal goals. Investors should ensure that they obtain all available relevant information before making any investment. Any forecasts, figures, opinions or investment techniques and strategies set out are for information purposes only, based on certain assumptions and current market conditions and are subject to change without prior notice. All information presented herein is considered to be accurate at the time of production, but no warranty of accuracy is given and no liability in respect of any error or omission is accepted. It should be noted that investment involves risks, the value of investments and the income from them may fluctuate in accordance with market conditions and taxation agreements and investors may not get back the full amount invested. Both past performance and yields are not reliable indicators of current and future results.

What I Care About This Week | 2022 Sep 12

by Franklin J. Parker, CFA

The Summary

  • The Bottom Line. Overall, the economic data continues to be okay—not great, not bad, but just okay. Last week’s data was pretty light, but there is a lot of data posting this week that could easily move markets. The Federal Reserve meets next week to deliver a decision on rates, so all of this week’s data will be interpreted in that light. Fed members have given guidance that a 0.75% rate hike is likely, so that is priced in. A move of less would boost markets, more would push prices down. My view continues to be that there is some upside in these markets, though I do expect it will be rocky. However, once people stop buying stuff, I expect a recession won’t be too far behind.

  • Last week, consumer credit data for July showed a decline from June’s figure, a good sign, but the general trend is still higher. Jobless claims were lower than expected and wholesale inventories were down. Overall, it was a pretty light data week, and the data continues to be mixed (though generally okay).

  • In contrast to last week, this week is fairly heavy on data. Inflation figures for August post on Tuesday, producer prices (one of the Fed’s preferred gauges of inflation) post on Wednesday, retail sales for august post on Thursday along with industrial production (one of my favorite economic indicators). Finally, consumer sentiment posts on Friday. All of this data could easily push markets around: especially with the Fed’s rate decision coming next week.

The Details

The past few years have turned most professional investors into Fed watchers, and this begs the question: why does the Fed matter so much?

The Federal Reserve has the responsibility for controlling the money supply and influencing interest rates. This supports their dual mandate: to keep inflation low and employment at full capacity.

These two tools have the side effect of pushing market prices around, though some of that is intentional. By raising the rate they pay banks, the Fed is able to pull cash out of the general economy, making less credit available to businesses. This tends to constrain business activity. Of course, the inverse is also true—markets have benefitted from low rates over the past decade.

Increasing the amount of cash in the economy tends to push market prices up—both because investors themselves have more cash to put to work, but also because it increases the amount of credit available to businesses. The inverse here is also true.

Given the power of these forces, central banks can exert a lot of influence over market prices. During times like this, when the moves are very aggressive, prices will respond quite strongly. Of course, markets benefitted from aggressive moves in 2020, but those moves served to boost prices rather than pull them down.

In the end, however, prices will tend to follow the fundamentals of the economy. Profit growth is what drives prices, so while the Fed influences valuations in the short term, it is these bigger forces that will drive longer-term prices.

Chart of the Week

One way to measure the amount of cash in the economy is to look at the amount of assets on a central bank’s balance sheet, which is what this week’s chart shows. When a central bank “shrinks their balance sheet,” they are reducing the amount of cash in the economy, constraining credit, and generally slowing down the economy.

As this week’s chart shows, central banks globally are decreasing the size of their balance sheets, and at a quickening pace. Markets are reacting negatively to this change in policy.

This document is a general communication being provided for informational purposes only. It is educational in nature and not designed to be taken as advice or a recommendation for any specific investment product, strategy, plan feature or other purpose in any jurisdiction, nor is it a commitment from Directional Advisors to participate in any of the transactions mentioned herein. Any examples used are generic, hypothetical and for illustration purposes only. This material does not contain sufficient information to support an investment decision and it should not be relied upon by you in evaluating the merits of investing in any securities or products. In addition, users should make an independent assessment of the legal, regulatory, tax, credit, and accounting implications and determine, together with their own financial professionals, if any investment mentioned herein is believed to be appropriate to their personal goals. Investors should ensure that they obtain all available relevant information before making any investment. Any forecasts, figures, opinions or investment techniques and strategies set out are for information purposes only, based on certain assumptions and current market conditions and are subject to change without prior notice. All information presented herein is considered to be accurate at the time of production, but no warranty of accuracy is given and no liability in respect of any error or omission is accepted. It should be noted that investment involves risks, the value of investments and the income from them may fluctuate in accordance with market conditions and taxation agreements and investors may not get back the full amount invested. Both past performance and yields are not reliable indicators of current and future results.

What I Care About This Week | 2022 Sep 6

by Franklin J. Parker, CFA

The Summary

  • Last week’s economic data generally showed a strong underlying economy. The unemployment rate ticked up, but that was largely due to workers coming back into the labor force and looking for work. There are still 1.8 open jobs for every one unemployed person, and there were 315,000 jobs added in August. On the downside, factory orders ticked down for the month, but that data was offset by today’s service sector PMI showing that the services industry got a bit of a boost in August.

  • This week we get a peek into consumer credit data. Spending has largely remained strong despite lower real wages because consumers have been willing to dip into their savings. The next and last step is dipping into credit. An expansion of payment burdens and/or credit outstanding could be a signal that consumers are beginning to feel the pinch and a slowdown in spending would not be too far behind. We also get wholesale inventories, a figure that has been swinging wildly post-Covid.

  • I expect markets to be rocky for the next several months. Investors are pricing and repricing the Federal Reserve’s actions all the while trying to better understand the growth story for both the economy and corporate earnings. That said, it is my view that the general trend will be up, at least until consumers slow their purchasing and corporate profits start to weaken. Of course, the risks you should take are always informed by your goals. We cannot manage money in the abstract!

The Details

Investing with a mind toward ESG (environmental, social, and governance factors) has grown in both popularity and assets over the past decade. The Economist recently ran an entire special report on the topic, and there is more to unpack than we have space for. Even so, let’s look at it very briefly.

First, what is it? ESG investing involves looking at companies not just through the lens of risk and return, but also with a mind to their impact on the environment, their impact on the communities in which they operate (social concerns), as well as their overall governance, or any other non-financial factors an investor may be concerned with.

Unfortunately, the financial industry has taken the same tack they always have when it comes to this important topic: they have built products and have expected investors to buy them.

But ESG investing, along with its cousins impact investing and ethical investing, are all very personal endeavors. In my experience, every investor has a different take on exactly what this kind of investing means to them. Also overlooked by the industry as a whole: investors are often required to make tradeoffs when the E, S, and G might be in conflict. Tesla, for example, might be a net positive for the environment (the E in ESG), but its treatment of employees and its dictatorial governance structure generally give it low scores in the social and governance components (the S and G in ESG). An investor, then, must weigh the personal importance of each of those scores and decide whether such a company fits in their personal ESG mandate. Some may decide it fits, while others may decide it does not.

And that is the critical point: an ESG investing mandate is both important and very personal. There is no one-size-fits-all, so investors need an advisor who can talk through these important issues and implement individualized solutions.

This is an area we would be eager to help you navigate.

Chart of the Week

The Wall Street Journal reported a slight uptick in the defaults on low-credit-quality bonds this month. While it is a small corner of the market, there is worry that it may begin to spread as interest rates rise and profits come under pressure.

Delinquency rates on commercial loans is a metric that I follow closely. Typically, leading into a recession, delinquency rates start to rise. We haven’t seen a significant uptick on delinquency rates just yet, though this figure only posts quarterly (and the last data we have is from the first quarter of this year). If delinquency rates do begin to rise meaningfully, investors should grow more cautious.

This document is a general communication being provided for informational purposes only. It is educational in nature and not designed to be taken as advice or a recommendation for any specific investment product, strategy, plan feature or other purpose in any jurisdiction, nor is it a commitment from Directional Advisors to participate in any of the transactions mentioned herein. Any examples used are generic, hypothetical and for illustration purposes only. This material does not contain sufficient information to support an investment decision and it should not be relied upon by you in evaluating the merits of investing in any securities or products. In addition, users should make an independent assessment of the legal, regulatory, tax, credit, and accounting implications and determine, together with their own financial professionals, if any investment mentioned herein is believed to be appropriate to their personal goals. Investors should ensure that they obtain all available relevant information before making any investment. Any forecasts, figures, opinions or investment techniques and strategies set out are for information purposes only, based on certain assumptions and current market conditions and are subject to change without prior notice. All information presented herein is considered to be accurate at the time of production, but no warranty of accuracy is given and no liability in respect of any error or omission is accepted. It should be noted that investment involves risks, the value of investments and the income from them may fluctuate in accordance with market conditions and taxation agreements and investors may not get back the full amount invested. Both past performance and yields are not reliable indicators of current and future results.

What I Care About This Week | 2022 Aug 29

by Franklin J. Parker, CFA

The Summary

  • The Federal Reserve’s annual retreat at Jackson Hole, WY was last week. Historically, this has been a time when Fed speeches are used to provide a defense of policy as well as some nuance and outlook for that policy. This meeting was no different. Chairman Powell reiterated the FOMC’s commitment to bringing down inflation even if that meant enduring “some economic pain.” This was one of the few times that the chairman acknowledged the Fed’s willingness to push the economy into a recession if it meant bringing down inflation.

  • This week we get unemployment data (3.5% expected), factory orders for August (0.2% increase), consumer confidence (slight rise), and job openings (slight decline). Investors are watching all of this through the lens of Federal Reserve activity, and also with an eye to a potential slowdown in the drivers of this economy. Those two are the main forces pulling prices around.

  • As I have often discussed here, investors are struggling to balance the influence of the Fed with the influence of corporate profit growth. Earnings season was generally ok, and outlooks are positive — most analysts expect ongoing profit growth through the end of the year. Yet the Fed’s ongoing guidance that rates are likely to trend higher has spooked many investors. This tug-of-war between generally ok economic data and the Federal Reserve is likely to continue for the near future. However, it is the economic data that will drive the general direction of market prices, at least in my view. As long as consumer demand is strong and corporate profit growth continues, I expect prices to drift higher.

The Details

When operating in a high-inflation environment, companies typically go through three stages.

Stage 1. Usually corporate executives see higher costs coming. To get ahead of those higher costs, they will raise prices as quickly as possible. This shows up as expanded profit margins and higher-than-normal earnings growth. Of course, that also means higher stock prices.

Stage 2. Thankfully, companies cannot raise prices forever so they are eventually forced to begin eating these higher costs. This shows up as lower margins and decreasing profits. As we would expect, this also means lower stock prices.

Stage 3. For as long as high inflation remains, this tug-of-war exists. Companies will raise prices when/if they can, and inflation will work to eat away their profits. Generally speaking, when viewed over a long period of time, companies tend to keep up with inflation, but it is certainly not a straight line. Inflation injects lots of volatility into profits and, by extension, market prices.

Fathom Consulting put out a chart this morning that shows we are firmly in Stage 2. After increasing profit margins over the past year, US companies are now unable to continue passing those increased costs on to consumers. This bodes well for future inflation figures, but creates a challenge for future profits.

Chart of the Week

This week’s chart is my favorite recession indicator: the 3-month US Treasury yield minus the 10-year US Treasury yield. When this figure turns negative, a recession is typically not too far behind. While financial news focuses on other yield curve indicators, I find that none of the others are as reliable as this one. While the indicator has moved very quickly toward zero over the past few months, it has not yet turned negative. Once it does, my “recession clock” begins in earnest — we typically get anywhere from 6 to 18 months before the recession hits. Interestingly, the indicator tends to become positive again just before the recession actually hits.

This document is a general communication being provided for informational purposes only. It is educational in nature and not designed to be taken as advice or a recommendation for any specific investment product, strategy, plan feature or other purpose in any jurisdiction, nor is it a commitment from Directional Advisors to participate in any of the transactions mentioned herein. Any examples used are generic, hypothetical and for illustration purposes only. This material does not contain sufficient information to support an investment decision and it should not be relied upon by you in evaluating the merits of investing in any securities or products. In addition, users should make an independent assessment of the legal, regulatory, tax, credit, and accounting implications and determine, together with their own financial professionals, if any investment mentioned herein is believed to be appropriate to their personal goals. Investors should ensure that they obtain all available relevant information before making any investment. Any forecasts, figures, opinions or investment techniques and strategies set out are for information purposes only, based on certain assumptions and current market conditions and are subject to change without prior notice. All information presented herein is considered to be accurate at the time of production, but no warranty of accuracy is given and no liability in respect of any error or omission is accepted. It should be noted that investment involves risks, the value of investments and the income from them may fluctuate in accordance with market conditions and taxation agreements and investors may not get back the full amount invested. Both past performance and yields are not reliable indicators of current and future results.